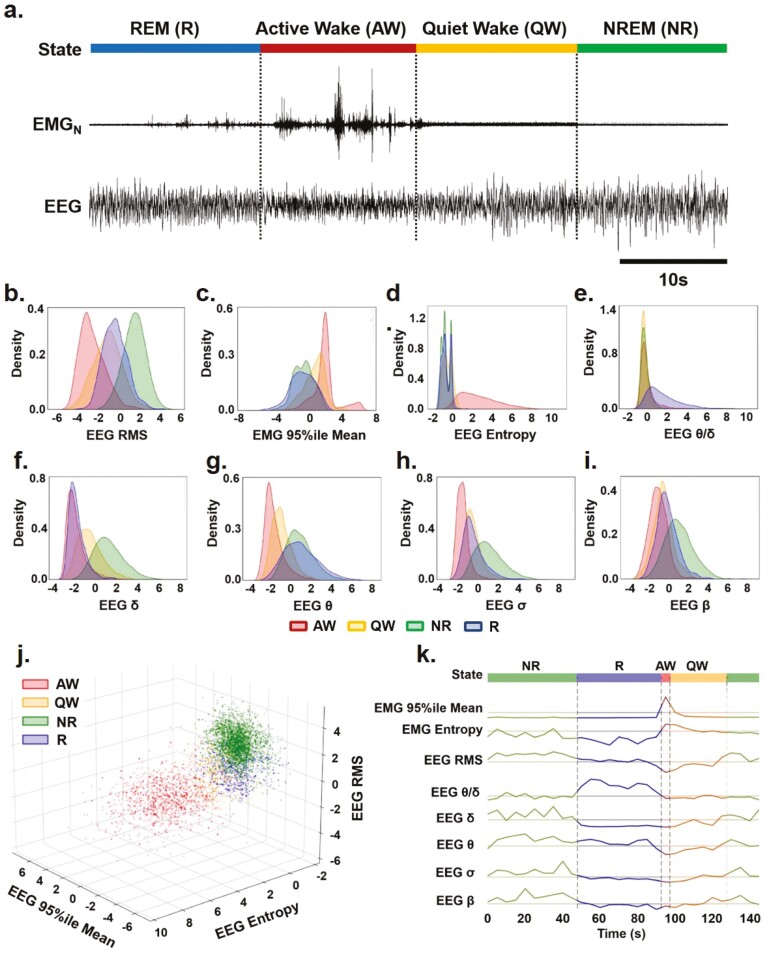
Figure 1.
Characterizing key EEG and EMG features for sleep–wake identification over time. (a) Representative EEG and nuchal EMG (EMGN) during Active Wake (AW), Quiet Wake (QW), Rapid Eye Movement (REM) sleep, and Non-REM (NREM) sleep. (b)–(i) Distribution of EEG and EMG parameters density used to identify sleep-wake states (i.e. AW-red, QW-yellow, NR-green: NREM and R-blue: REM) by SleepEns. Parameters are as follows: (b) EEG root-mean square (EEG RMS); (c) Top 5% EMG activity (EMG 95%ile Mean); (d) EEG spectral entropy; (e) EEG θ/δ power; (f) EEG δ power; (g) EEG θ power; (h) EEG σ power; and (i) EEG β power. The x-axes of all plots represent the feature values after processing. Distributions are drawn from 10 180 epochs in the test dataset. (j) A three-dimensional plot of three features (EMG 95th Percentile Mean, EEG Entropy, and EEG RMS) demonstrates a degree of separability between sleep-wake states. Axes represent the feature values after processing and data is drawn from a sample of 5090 epochs in the test dataset. (k) Eight features over the course of 30 epochs (150 s) illustrating changes in features as the animal progresses over each sleep–wake state.

