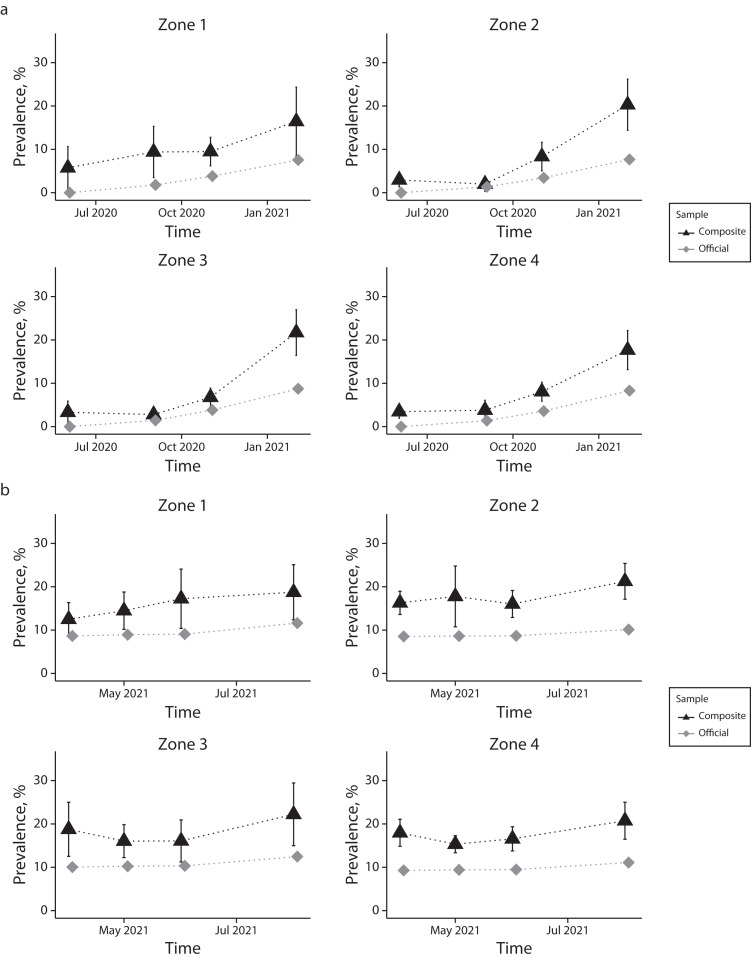
FIGURE 3—
Prevalence Estimates for a Composite of Probability and Volunteer Participants Who Tested Positive for SARS-CoV-2 Infections and Administratively Reported Official Rates by Geographic Zones for (a) Waves 1–4 and (b) Waves 5–8: Jefferson County, KY, June 2020‒August 2021
Note. IgG = immunoglobulin G; SARS-CoV-2 = severe acute respiratory syndrome coronavirus 2. Administratively reported data are from the Jefferson County health authority, Louisville Metro Public Health and Wellness. Vertical lines represent 95% confidence intervals. Waves 1–4 in panel a present participants positive for SARS-CoV-2 spike (S) protein‒specific IgG antibodies and administratively reported official rates. Waves 5–8 in panel b present unvaccinated participants positive for SARS-CoV-2 spike (S) protein‒specific IgG antibodies and vaccinated participants positive for SARS-CoV-2 nucleocapsid (N)‒specific IgG antibodies and absence of any self-reported previous infection or related symptoms before sampling and administratively reported official rates.

