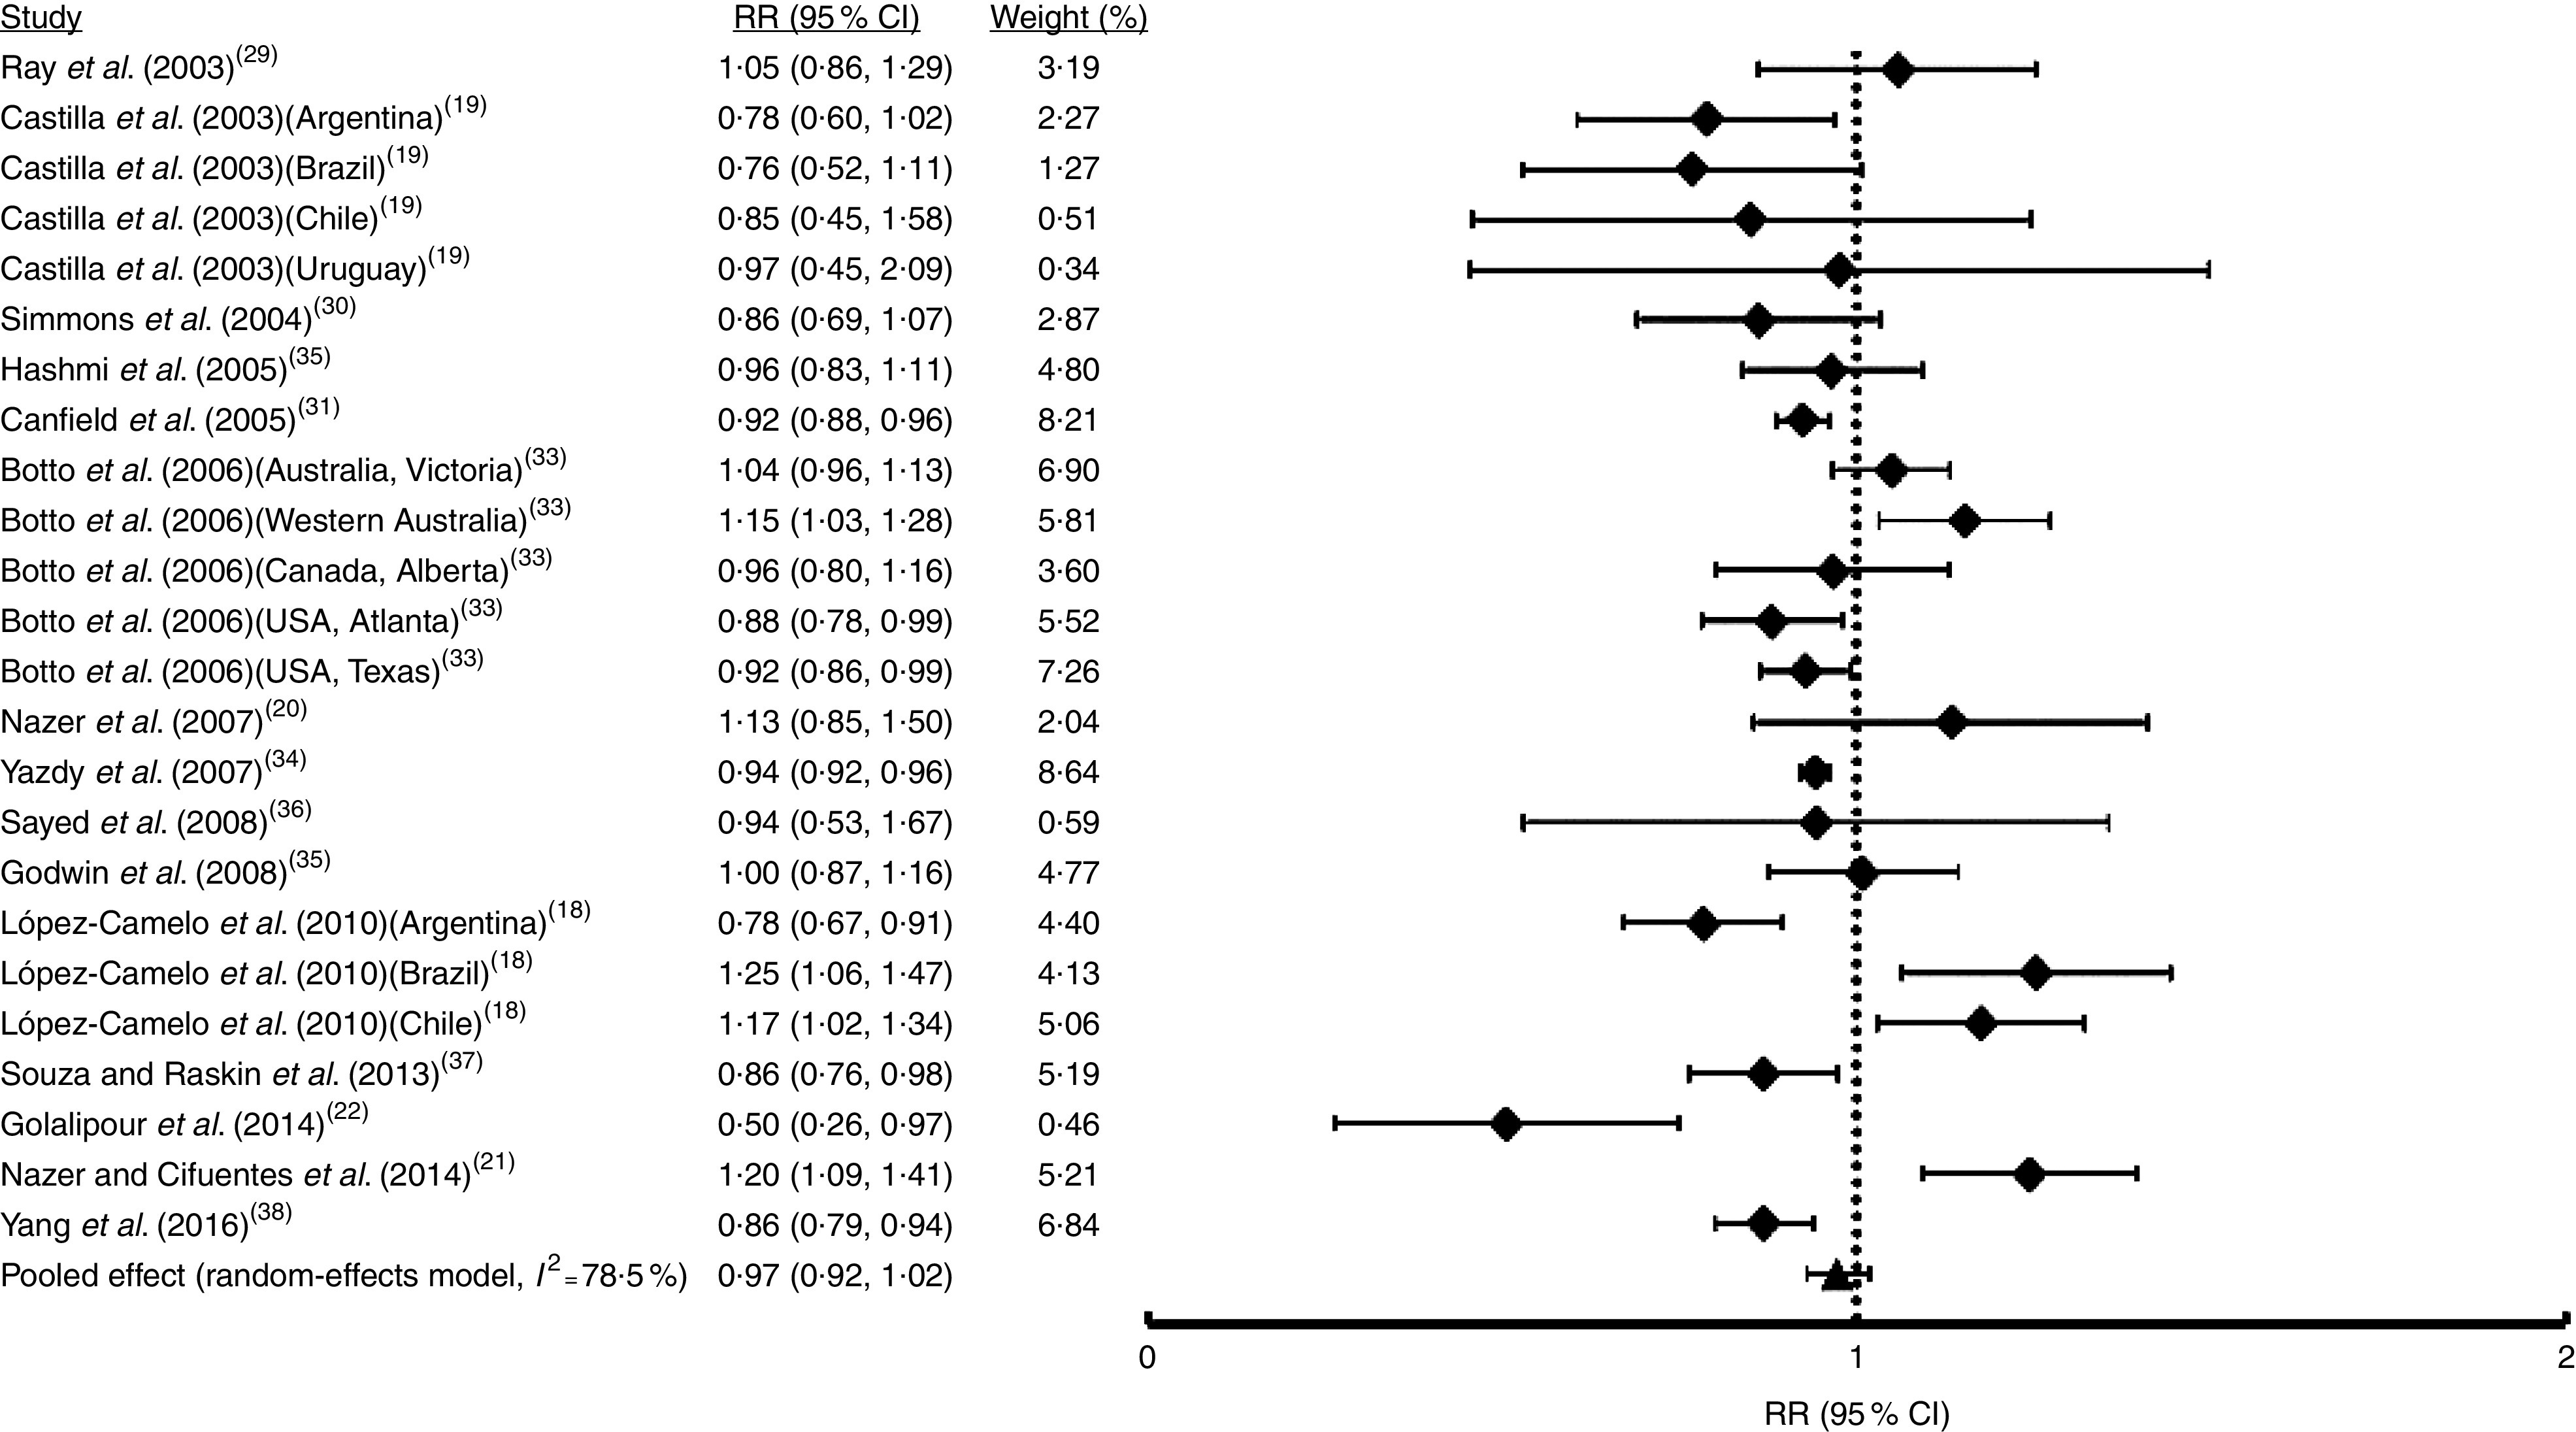
Fig. 2.

Forest plot showing the effect of folic acid fortification on the prevalence of total orofacial clefts (total OFC). The study-specific relative risk (RR) and 95 % CI are represented by the black square and horizontal line, respectively; the black triangle represents the pooled RR and the horizontal line represents the pooled 95 % CI; the dotted line at RR=1 represents the null effect
