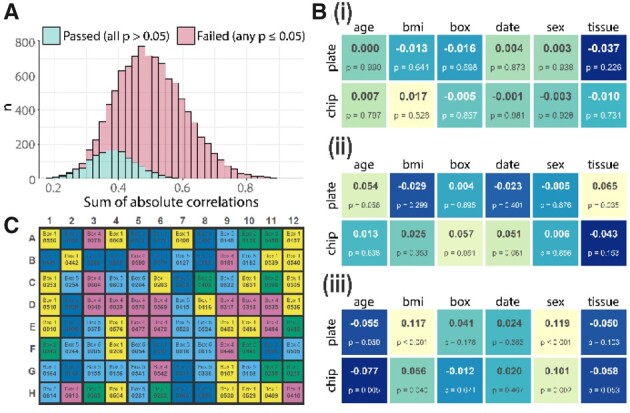
Fig. 1.

Overview of Omixer functionality and graphical output with (A) distribution of the sum of absolute correlations from 10 000 randomized layouts, coloured by filtering step outcome (B) resulting correlation matrices from the (i) optimal Omixer layout, (ii) median result and (iii) worst case scenario after simple randomization and (C) lab-friendly sample sheets created by Omixer as a PDF, showing the first plate colour coded by box number
