Figure 1.
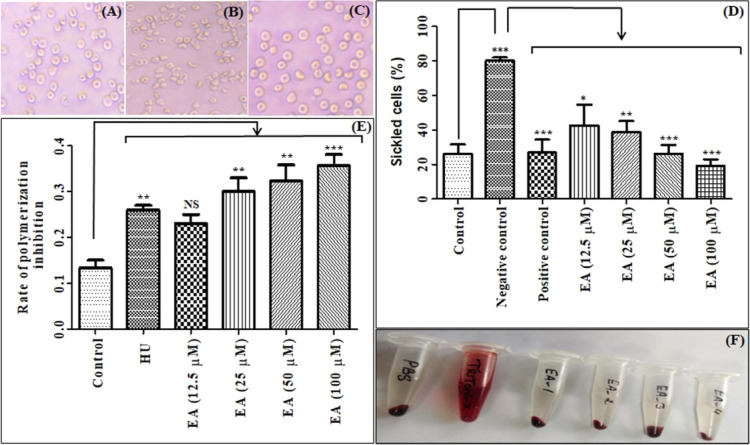
Representative images of anti-sickling activity: control blood (A); control blood after treatment with the inducing agent (negative control) (B); control blood after treatment with EA and subsequently with the inducing agent (C); effect of EA on the anti-sickling activity (D) and the rate of polymerization inhibition (E); representative images for the effect of EA on hemolysis (F) (EA_1, EA_2, EA_3, and EA_4 represent the concentration of EA at 0.01, 0.05, 0.1, and 1 mg/mL, respectively). Data are presented as mean ± SEM (n = 3). p < 0.05/0.01/0.001 denotes statistically significant (*/**/***). NS denotes not statistically significant.

