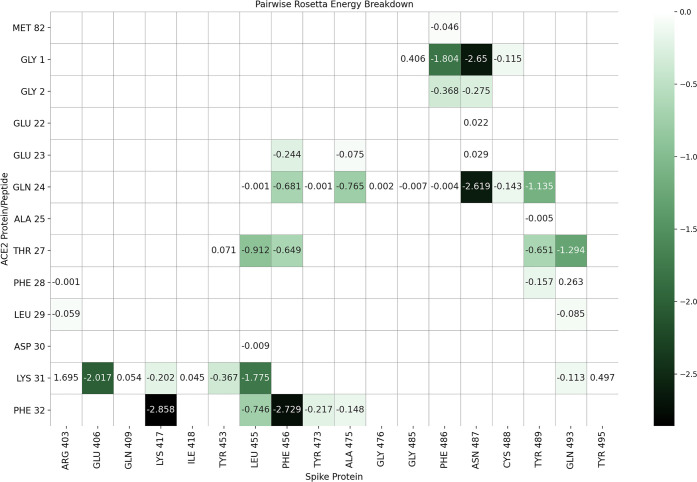
Figure 6.
Interaction energy breakdown for 18-mer residues in complex with SARS-CoV-2 spike. Energy values are calculated with Rosetta’s Residue Energy Breakdown and curated into the heat map. Interaction energies are labeled and negative (favorable) interactions are colored according to the scale. Positive values are shown but not colored.

