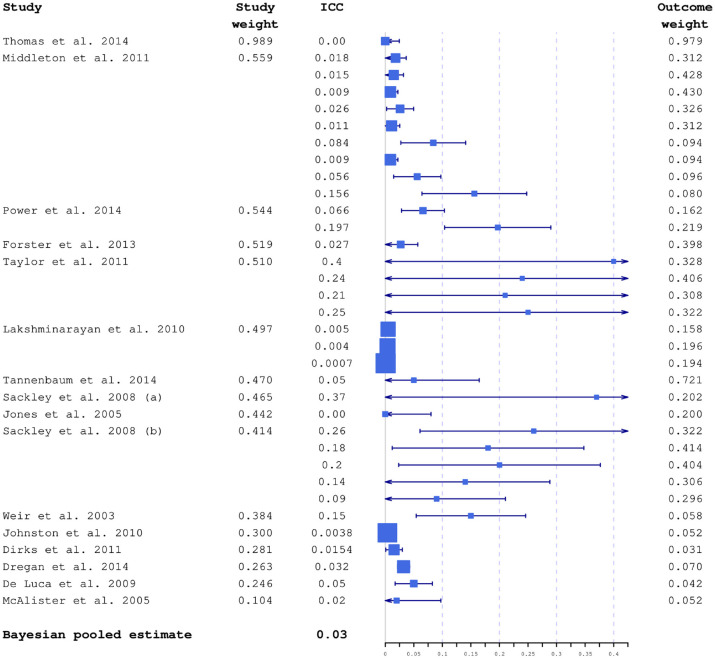
Figure 2.
ICC estimates included in the modelling plotted together with 95% confidence intervals and average study and outcome weights. Box sizes are inversely proportional to variances. The studies are ordered by decreasing relevance to the planned study, based on estimated average study weight. The largest weights were from the ICONS feasibility trial.

