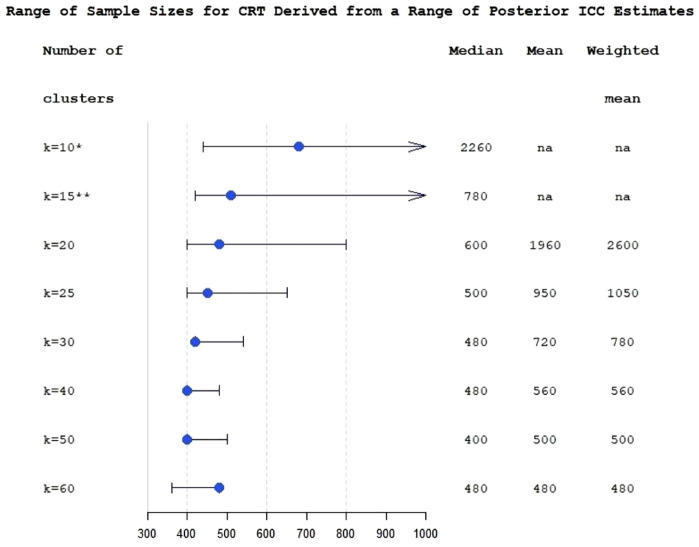
Figure 3.
Range of sample sizes derived for different ICC values from posterior interquartile range of ICC estimate for the varying number of clusters at fixed levels (k from 10 to 60), for cluster-randomised trial with k equal size clusters per arm. The bullets are sample sizes calculated using posterior median ICC. The whiskers correspond to 25% and 75% posterior ICC quantiles. Median, mean and weighted mean columns show sample sizes calculated using a classical multi-estimate method.
All numbers correspond to at least 80% power achieved; *: 80% power is not achievable for ICC 75% quantile; **: sample size corresponding to ICC 75% quantile is 1440; na: 80% power is not achievable for this number of clusters.

