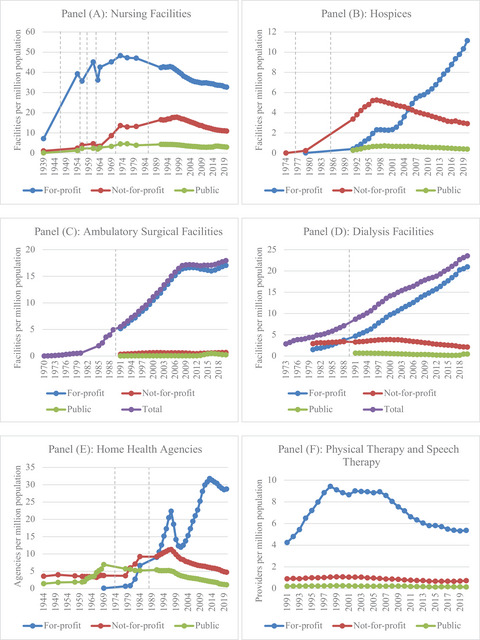
Figure 2.

Trends in Nonhospital Provider Supply by Ownership Type Through 2020. [Colour figure can be viewed at wileyonlinelibrary.com]
Vertical dashed lines represent discontinuities in data source. The authors’ analysis of published data from multiple sources (detailed below and in Appendix Note 1) as well as Medicare Provider of Service (M‐POS) microdata, 1991–2020. (A) 1939 facilities are nursing, convalescent, and rest homes; for‐profit is proprietary facilities; public is government facilities; not‐for‐profit is nonprofit facilities (sourced from National Office of Vital Statistics's Table 6 16 ). 1954 facilities are skilled nursing homes; for‐profit is proprietary facilities; not‐for‐profit is church‐related and nonprofit associations (sourced from Solon and Baney's Table 3 18 ). 1956 facilities are skilled nursing homes; for‐profit is proprietary facilities; not‐for‐profit is nonprofit facilities. N = 726 facilities (14% total) and n = 14,491 beds (9% total) had “unknown” ownership status this year and are not presented here (sourced from Brown's Table 1 19 ). 1961 facilities are skilled nursing homes; for‐profit is proprietary facilities; not‐for‐profit is church‐related and other voluntary nonprofit. 20 p14 1963, 1964, and 1969 data are from Resident Places surveys; facilities are nursing and personal care homes providing nursing care as the type of services; for‐profit is proprietary facilities; not‐for‐profit is nonprofit facilities; and public is government facilities. 1963 beds were calculated by multiplying average bed size by number of facilities; beds by ownership not available for 1969 (1963 sourced from National Center for Health Statistics, Wunderlich's Tables 1 and A 21 ; 1964 from National Center for Health Statistics, Taube's Table 8 22 ; 1969 from National Center for Health Statistics, Mathis's Table F 23 and Gagnon's Table C 41 ). 1973, 1976, and 1980 data are from the National Master Facility File. Facilities are nursing and related care homes (sourced from National Center for Health Statistics, Strahan's Tables B and E 42 ). The data exclude facilities with <25 beds; see Appendix for details. 1991–2020 data: authors’ analysis of M‐POS. Facilities included those active in Medicare classified as skilled nursing facility (SNF), a SNF/nursing facility (NF) (dually certified), SNF (distinct part), or NF. (B) 1974 data are the founding of the Connecticut Hospice. 1979 data come from survey of the General Accounting Office. 25 p11 1991–2020 data are from the authors’ analysis of the M‐POS files. The data exclude “other” hospices (≤11% for all years). (C) 1973–1989 figures as compiled by Durant and Battaglia. 26 This source does not provide figures by ownership status in public/for‐profit/not‐for‐profit; we present totals for comparison with later years. 1991–2020 data are from the authors’ analysis of the M‐POS files. (D) 1973–1979 (sourced from US Department of Health and Human Services’ Table 1 28 ) and 1980–1988 (sourced from the Institute of Medicine's Table 6–4 27 ) figures on dialysis facilities are from the Health Care Financing Administration; we lack data on ownership for 1973–1979 but present totals for comparison across periods. 1991–2020 data are from the authors’ analysis of the M‐POS files. (E) 1944–1969 figures are Public Health Service or Social Security Administration data compiled by Ryder and colleagues (sourced from Ryder, Stitt, and Elkin's Tables 1 and 2 24 ). 1978, 1980, 1982, and 1984 data are Health Care Financing Administration data compiled by the Institute of Medicine (sourced from the Institute of Medicine's Table 2.8 1 ). See the Appendix for details on how ownership was aligned across survey years. 1991–2020 data are from the authors’ analysis of the M‐POS files. (F) From the authors’ analysis of the 1991–2020 M‐POS files.
