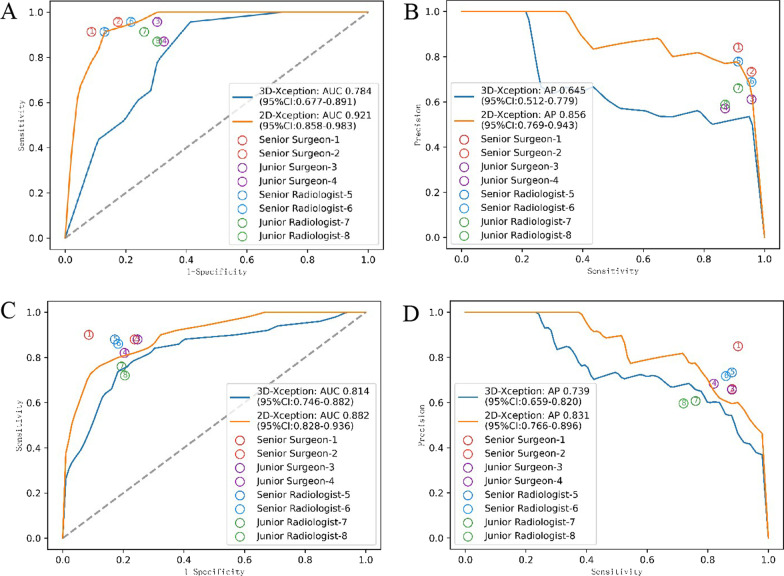
Fig. 3.
Diagnostic performance of the models and the reading clinicians. A The diagnostic performance of 8 clinicians was dotted in the ROC curves of the 2D and 3D CNN models according to the sensitivity and specificity for the surgery test set. B The diagnostic performance of 8 clinicians was dotted in the Precision and Recall (PR) curves of the 2D and 3D CNN models according to the precision and sensitivity for the surgery test set. C The diagnostic performance of 8 clinicians was dotted in the ROC curves of the 2D and 3D CNN models according to the sensitivity and specificity for the internal test set. D The diagnostic performance of 8 clinicians was dotted in the PR curves of the 2D and 3D CNN models according to the precision and sensitivity for the surgery test set on the internal test set

