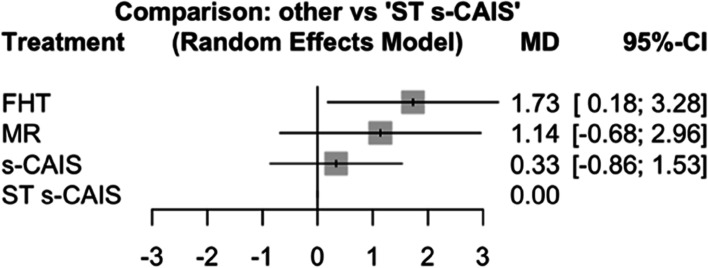
Fig. 3.
Forest plot of the mean differences (MD) between MR, s-CAIS and ST s-CAIS orthodontic mini-implants placement techniques respect the conventional free-hand technique at coronal entry-point. Column 1 lists the orthodontic mini-implants placement techniques included in the meta-analysis. Column 2 is the forest plot itself, the graphic part of the representation. It plots the coronal deviation between the orthodontic mini-implants placement techniques on both sides of the null effect line, represented by the conventional free-hand technique. Column 3 describes the mean deviation of each orthodontic mini-implants placement techniques respect the conventional free-hand technique, and column 4 presents the confidence interval

