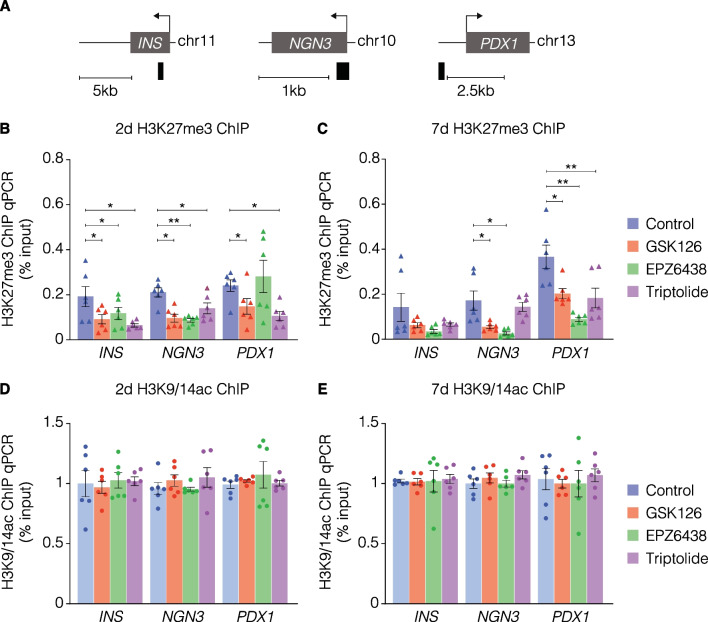
Fig. 4.
Reduction of H3K27me3 content associated with the chromatin of DNA in the INS-IGF2, NGN3, and PDX1 promoter regions following inhibition of EZH2. A H3K27me3 content was assessed by using amplifiers (black bars against DNA regions corresponding to the promoters of INS, NGN3 and PDX1). Quantitative PCR analysis of H3K27me3 associated DNA using ChIP following B 2-day and C 7-day stimulation of human pancreatic ductal epithelial cells compared to vehicle control. Data are displayed as the mean input signal against H3K27me3 abundance ± S.E.M of 3 replicates. Each triangle plot represents one technical replicate. Statistically significant differences were determined using Student’s t-tests against control. *P < 0.05, **P < 0.01, ***P < 0.001. Quantitative PCR analysis of H3K9/14ac associated DNA using ChIP following D 2-day and E 7-day stimulation of human pancreatic ductal epithelial cells compared to vehicle control. Data are displayed as the mean input signal against H3K9/14ac abundance ± S.E.M of 3 replicates. Each dot plot represents one technical replicate. Statistically significant differences were determined using Student’s t-tests against control

