Fig. 2.
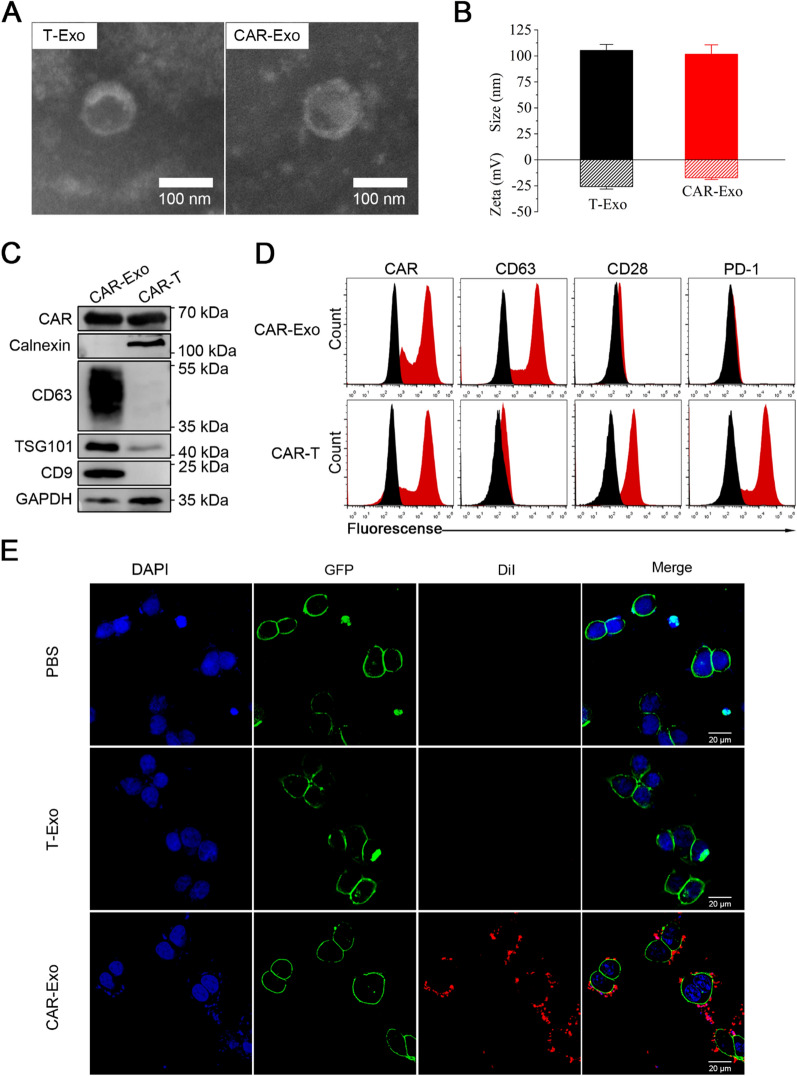
Preparation and characterization of CAR-Exos. A Representative TEM image of T-Exo and CAR-Exo. Scale bar: 100 nm. B Size distribution and zeta potential of T-Exos and CAR-Exos measured by NTA and DLS. Data are presented as the mean ± SD of three biological replicates. C The expression of CAR protein and exosomal markers in CAR-Exos or whole-cell lysates of CAR-T cells were analyzed by Western blotting. D Flow cytometric analyses of CAR-Exos conjugated to latex beads or CAR-T cells. The histograms shown isotype controls (black) and positive expression (red). E Representative Confocal laser scanning microscopy (CLSM) images of CAR-Exos bound to the surface of MSLN-LLC cells (green). T-Exos and CAR-Exos were labeled with DiI (red) and DAPI (blue) labeled nuclei of MSLN-LLC cells. CAR-Exos showed a higher binding affinity to the MSLN protein than T-Exos. Scale bar: 10 μm

