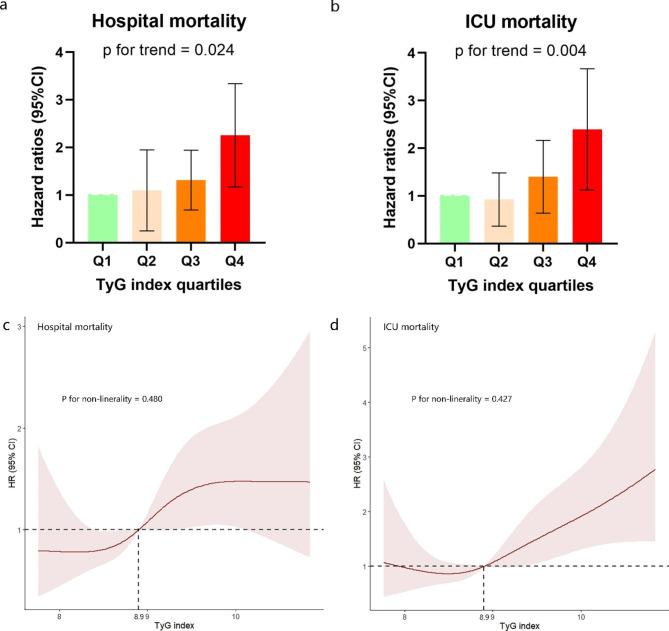
Fig. 3.
(a), (b): Hazard ratios (95% CIs) for hospital mortality according to TyG index quartiles after adjusting for age, sex, BMI, heart failure, atrial fibrillation, diabetes, sepsis, white blood cell, red blood cell, platelet, serum creatinine. Error bars indicate 95% CIs. The frst quartile is the reference. (c), (d): Restricted cubic spline curve for the TyG index hazard ratio. Heavy central lines represent the estimated adjusted hazard ratios, with shaded ribbons denoting 95% confdence intervals. TyG index 8.9 was selected as the reference level represented by the vertical dotted lines. The horizontal dotted lines represent the hazard ratio of 1.0. (c) Restricted cubic spline for hospital mortality. (d) Restricted cubic spline for ICU mortality. HR, hazard ratio; CI, confdence interval; ICU, intensive care unit; TyG, triglyceride-glucose

