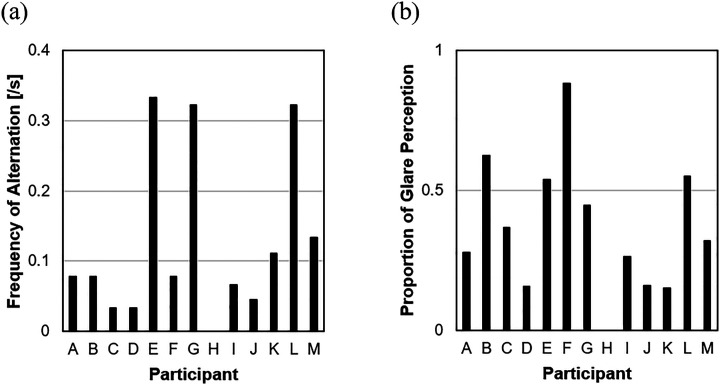
Figure 4.
Results of 30 s observations at the switching glare stimulus (Figure 2). Each bar represents the mean of three trials for each participant. (a) Frequency of perceptual alternation per second. (b) Proportion of glare perception to observation duration.

