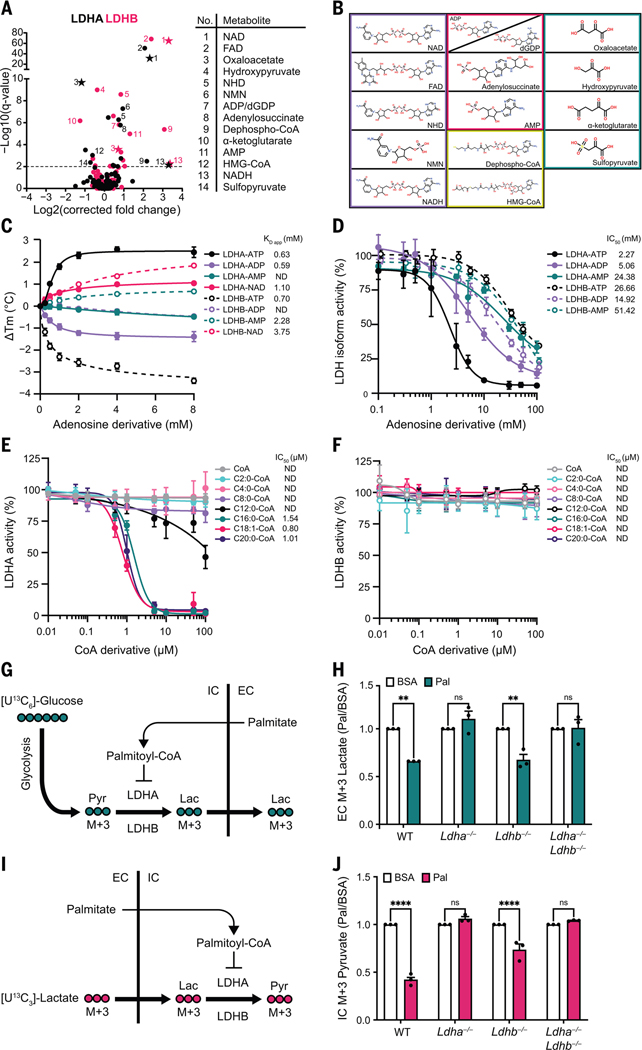
Fig. 4. ATP and long-chain acyl-CoAs inhibit LDH in an isoform-specific manner.
(A) Volcano plots of MIDAS metabolite interactions with LDHA (black) and LDHB (pink). Specific, significant metabolites are numbered and labeled. Stars indicate a previously known human PMI, primarily sourced from BRENDA (https://www.brenda-enzymes.org/index.php). MIDAS analysis of LDHA and LDHB was performed by triplicate equilibrium dialysis and technical triplicate FIA-MS injections. Significant PMIs identified have a Q < 0.01 (dotted line). (B) Metabolite classes that interact with LDHA and LDHB from (A) (nicotinamides and dinucleotides, purple; adenosine nucleotide derivatives, pink; CoA derivatives, yellow; keto acids, teal). (C) Ligand-induced DSF melting point analysis of LDHA (solid lines, filled circles) and LDHB (dotted lines, open circles) with ATP (black), ADP (light purple), AMP (teal), and NAD (pink). KD app was determined from triplicate experiments, each with sextuplicate technical replicates, by fitting the specific binding and Hill slope equation from GraphPad Prism 9. Means ± SDs are plotted from triplicate experiments. (D) Enzyme activity of LDHA (solid lines, filled circles) and LDHB (dotted lines, open circles) treated with ATP (black), ADP (light purple), or AMP (teal). (E and F) Enzyme activity of LDHA or LDHB treated with CoA (gray), acetyl-CoA (C2:0-CoA; cyan), butyryl-CoA (C4:0-CoA; light pink), octanoyl-CoA (C8:0-CoA; light purple), lauroyl-CoA (C12:0-CoA; black), palmitoyl-CoA (C16:0-CoA; teal), oleoyl-CoA (C18:1-CoA; pink), and saturated arachidoyl-CoA (C20:0-CoA; purple). [(D) to (F)] IC50 was determined from triplicate experiments, each with triplicate technical replicates using GraphPad Prism 9. ND, not determined. Means ± SDs are plotted from triplicate experiments. (G) Schematic of [U13C6]-glucose metabolism in cells treated with palmitate-conjugated BSA after inhibition of the mitochondrial pyruvate carrier with UK5099. Pyr, pyruvate; Lac, lactate; IC, intracellular; EC, extracellular. (H) Fold change of extracellular [U13C3]-lactate collected from the growth media of the indicated H9c2 cell lines in response to treatment with palmitate-conjugated BSA (Pal) relative to BSA-vehicle control (BSA). Absolute abundance is displayed in fig. S4H. (I) Schematic of [U13C3]-lactate metabolism in cells treated with palmitate-conjugated BSA after inhibition of the mitochondrial pyruvate carrier with UK5099. (J) Fold change of intracellular [U13C3]-pyruvate in indicated H9c2 cell lines in response to treatment with palmitate-conjugated BSA (Pal) relative to BSA-vehicle control (BSA). Absolute abundance is displayed in fig. S4J. [(H) and (J)] Experiments were performed in triplicate, and means ± SDs are displayed. A two-way analysis of variance (ANOVA) and Sidak’s multiple comparison test (GraphPad Prism 9) was performed between Pal and BSA samples (ns, not significant; **P < 0.005; ****P < 0.0001).

