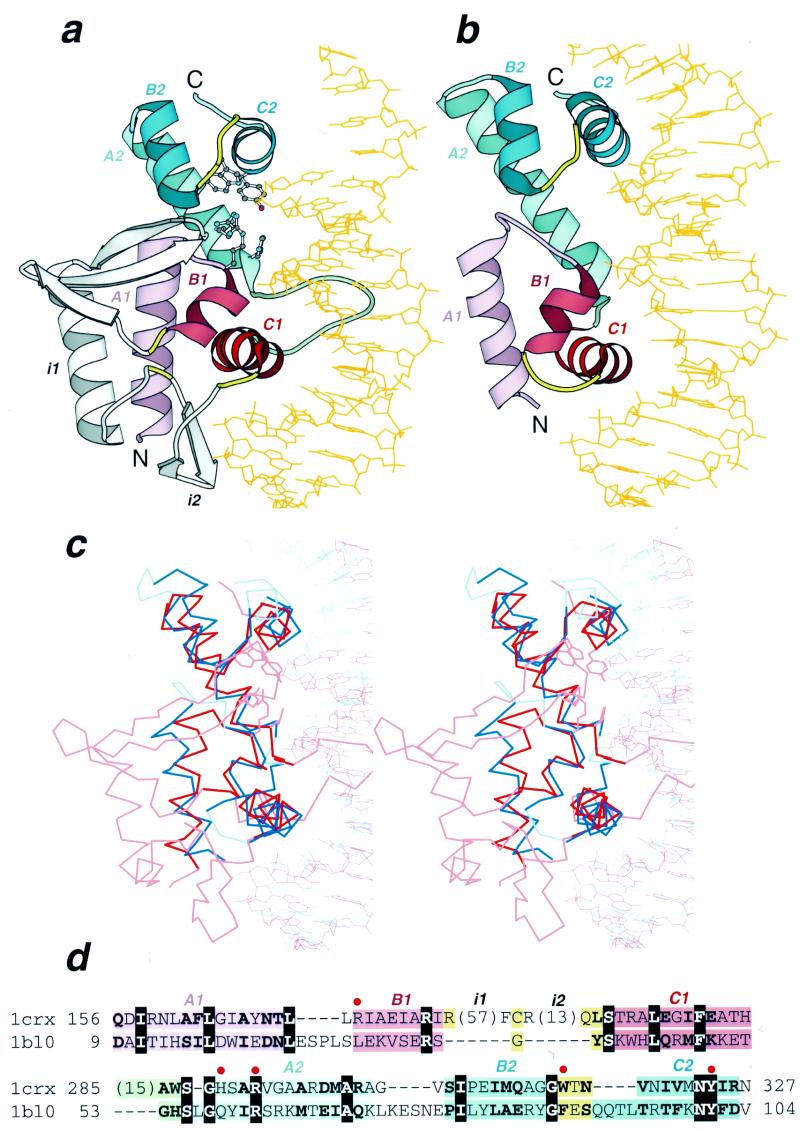
Figure 1.
Structural similarity between Cre recombinase and MarA. Ribbon diagrams of (a) Cre recombinase from bacteriophage P1 (pdb entry 1crx, residues A154–A330) and (b) MarA transcription regulator from E.coli (pdb entry 1bl0, residues A9–A106) in complex with DNA drawn by Bobscript (48), a modified version of Molscript (49). The structures were superimposed and then separated for clarity. N- and C-termini are labeled. The spatially equivalent structural elements are colored correspondingly in the two structures. N- and C-terminal HHTH domains are colored red and blue, respectively. α-Helices of the HTH motifs are in darker color. The turns in the HTH motifs are yellow and the loop connecting two HHTH domains is green. Long insertions (i1 and i2) in the first HHTH domain of Cre recombinase are shown in gray. DNA chains are orange. α-Helices are labeled A, B and C followed by a domain index (1 or 2). Side chains of active site residues in Cre recombinase are shown in ball-and-stick presentation. (c) The stereodiagram of Cre recombinase (red) and MarA (blue) superposition. The Cα traces of protein and DNA segments are shown. The regions used in r.m.s.d. minimization are outlined in darker colors. Superposition was performed using the InsightII package (MSI Inc) according to the DALI alignment (34). (d) Structure-based sequence alignment of Cre recombinase (1crx) and MarA (1bl0) generated by DALI (34). The starting and ending residues are numbered and the segments are labeled with the same letters as in (a) and (b). Color shading of the regions is the same as in (a) and (b). Invariant residues are shown in bold white letters boxed with black and conserved substitutions are shown in bold. The number of residues omitted from the alignment are shown in parentheses. The active site residues are marked with a red dot above the alignment and their side chains are displayed in (a).

