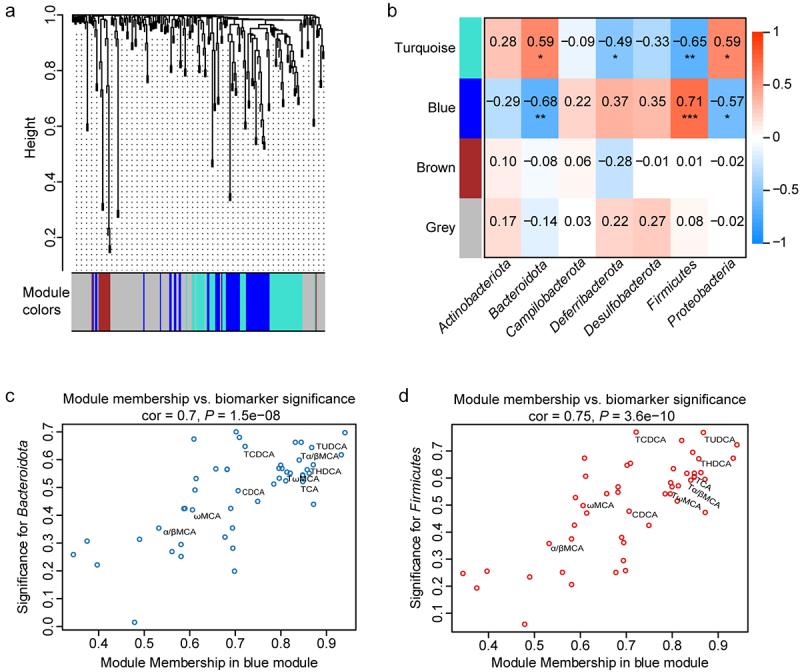
Figure 3.

Correlation analysis of gut bacterial phyla and liver metabolites by WGCNA. (a) Metabolite modules obtained based on the 214 metabolites in the liver in LL, LKO, and AKO mice. (b) Heatmap presenting module–trait relationships based on the Pearson method. Each row corresponds to a module eigengene (ME) and each column to the abundance of a bacterial phylum. The corresponding correlation coefficient is displayed at the top of the cell, and corresponding P value for each module is displayed by the star. *: P < 0.05, **: P < 0.01, ***: P < 0.001. (c-d) The relationship between module membership (MM) in blue module and biomarker significance (BS) of Bacteroidota (c) and Firmicutes (d). The MM of a node represents the correlation between the node profile and the ME, and the BS of a node represents the correlation between the node profile and a given trait. The greater absolute value of the MM indicates the node is more highly representative of the module, and the greater absolute value of the BS represents the node is more biologically significant.
