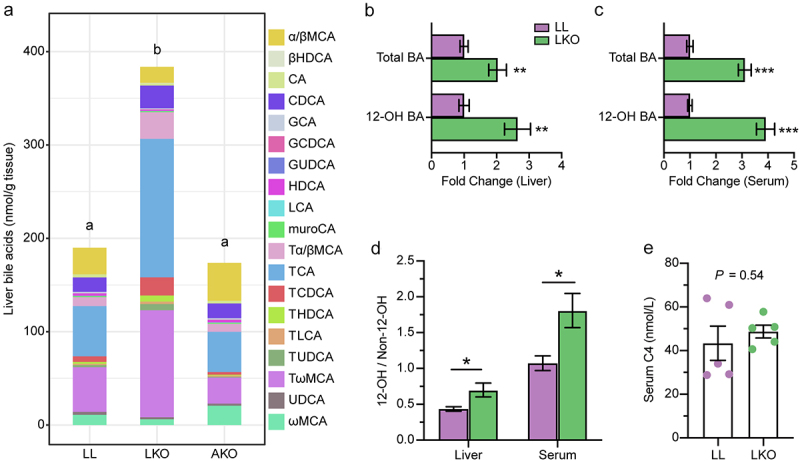
Figure 4.

Change of the bile acid profile in different mice. (a) Composition of the liver bile acid pool in LL, LKO, and AKO mice. (b-c): Fold change of total bile acid and 12-OH bile acids in the liver (b) and serum (c) between the LL and LKO group. (d) Ratio of 12-OH bile acids to non-12-OH bile acids in the liver and serum of LL and LKO mice. (e) Content of serum C4 in LL and LKO mice. *: P < 0.05, **: P < 0.01, ***: P < 0.001.
