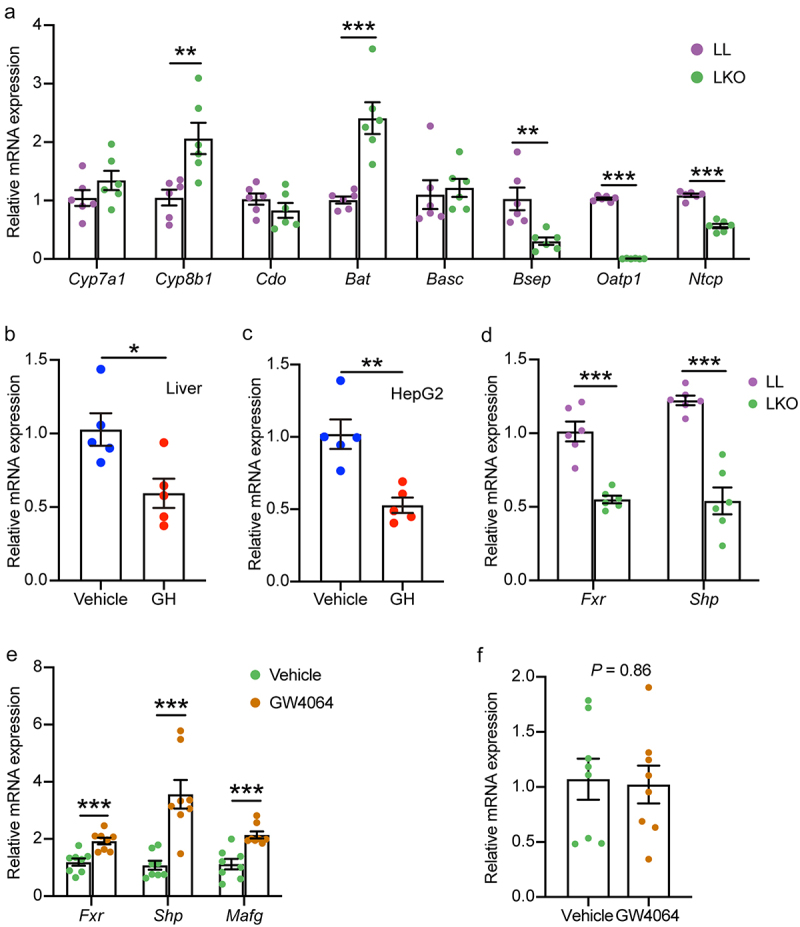
Figure 5.

Analysis of bile acid metabolism regulation by hepatic GH signaling. (a) Expression level of genes related to bile acid metabolism in the liver of LL and LKO mice. (b-c) Expression level of Cyp8b1 in rhGH treated HFD fed mice (b) and HepG2 cells (c). (d) Expression level of hepatic Fxr and Shp in LL and LKO mice. (e) Expression level of hepatic Fxr and its downstream Shp and MafG in LKO mice after GW4064 treatment. (f) Expression level of hepatic Cyp8b1 in the GW4064 treated LKO mice. *: P < 0.05, **: P < 0.01, ***: P < 0.001.
