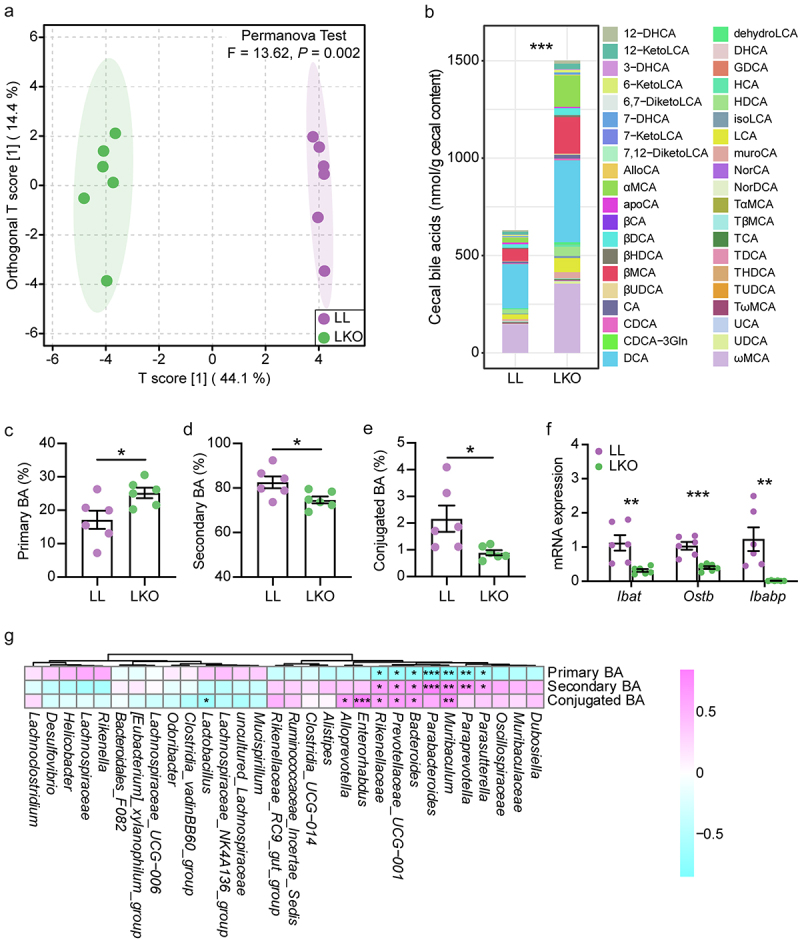
Figure 6.

Bile acid metabolism in the cecum and its correlation with gut bacteria. (a) OPLS-DA plot showing the difference of bile acid profile between the LL and LKO mice. (b) Composition of the cecal bile acid pool in the LL and LKO mice. (c-e) Comparison of the abundance of primary bile acid (c), secondary bile acid (d) and conjugated bile acid (e) between the LL and LKO mice. (f) Expression level of the genes related to bile acid reabsorption. (g) Correlation between the bile acid and the top 30 most abundant bacterial genera. *: P < 0.05, **: P < 0.01, ***: P < 0.001.
