
Figure 7.
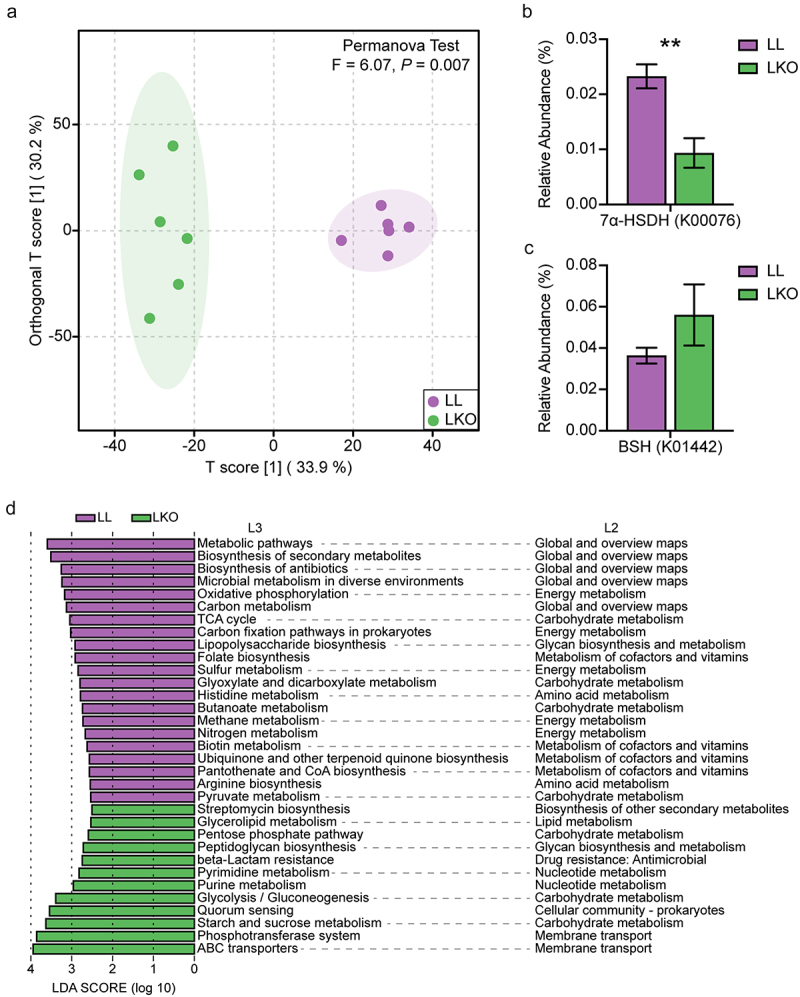
Prediction of gut microbiota function by Tax4Fun2. (a) OPLS-DA plot showing the difference of gut microbiota function at the KO level in the LL and LKO mice. (b-c) Comparison of the relative abundance of 7α-HSDH gene (b) and BSH gene (c) between the LL and LKO mice. *: P < 0.05, **: P < 0.01, ***: P < 0.001. (d) LDA analysis revealing the differentially enriched functional pathways between the LL and LKO mice.