
Figure 9.
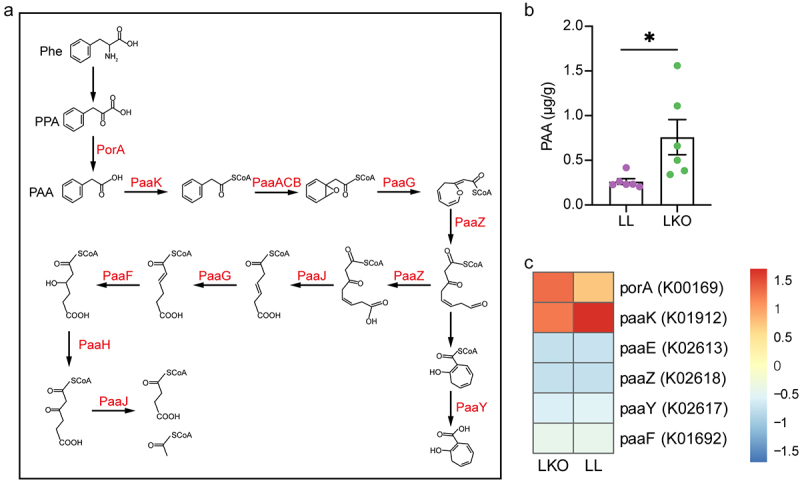
PAA metabolism in the LL and LKO mice. (a) Schema of bacterial PAA metabolism pathway. (b) Comparison of liver PAA content between the LL and LKO mice. (c) Relative abundance of PAA metabolism genes predicted by Tax4Fun2 in the cecal content of LL and LKO mice.