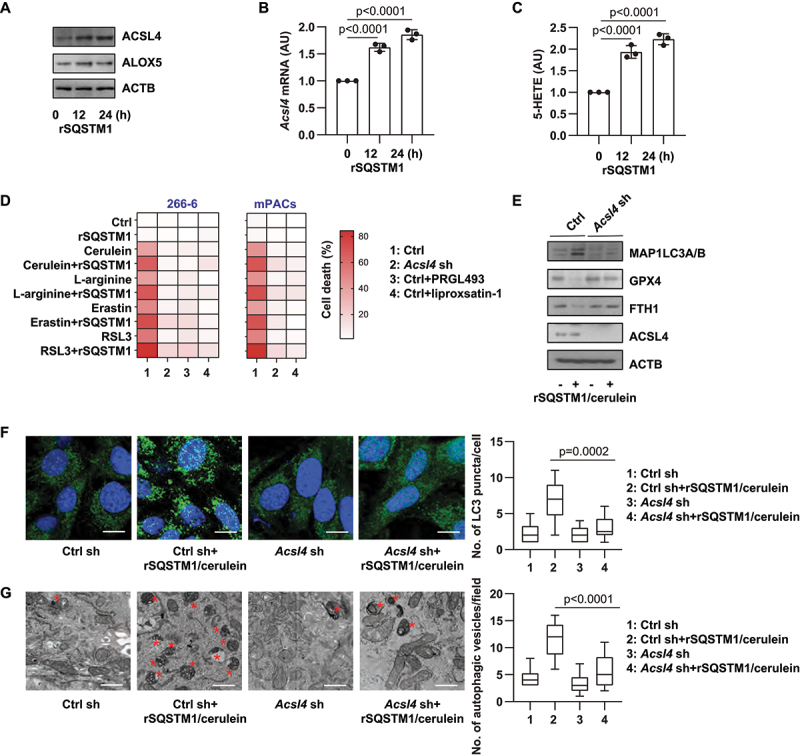
Figure 4.

ACSL4-mediated autophagy and ferroptosis are induced by rSQSTM1. (A) Western blot analysis of ACSL4 and ALOX5 protein expression in 266–6 cells after treatment with rSQSTM1 (2 ng/ml) for 12–24 h. (B, C) Analysis of Acsl4 mRNA expression and intracellular 5-HETE levels in 266–6 cells after treatment with rSQSTM1 (2 ng/ml) for 12–24 h (n = 3 biologically independent samples; one-way ANOVA with Tukey’s multiple comparisons test on all pairwise combinations; data are presented as means ± SD). (D) Analysis of the effect of Acsl4 knockdown, PRGL493 (25 µM), or liproxstatin-1 (500 nM) on the level of cell death in 266–6 acinar cell line or primary mouse acinar cells (mPACs) after treatment with cerulein (100 nM), L-arginine (5 mg/mL), erastin (5 µM), or RSL3 (500 nM) in the absence or presence of rSQSTM1 (2 ng/ml) for 48 h (data are presented as a heat map of the mean of 3 biologically independent samples). (E) Western blot analysis of indicated protein expression in WT and Acsl4 knockdown 266–6 cells after treatment with cerulein (100 nM) plus rSQSTM1 (2 ng/ml) for 24 h. (F, G) Analysis of LC3 puncta formation and autophagic vacuoles in WT and Acsl4 knockdown 266–6 cells after treatment with cerulein (100 nM) plus rSQSTM1 (2 ng/ml) for 24 h (n = 10 fields/group; one-way ANOVA with Tukey’s multiple comparisons test on all pairwise combinations; data are presented as median value [black line], interquartile range [box], and minimum and maximum of all data [black line]; scale bar: 20 µm in F, 500 nm in G; red stars show autophagic vesicle).
