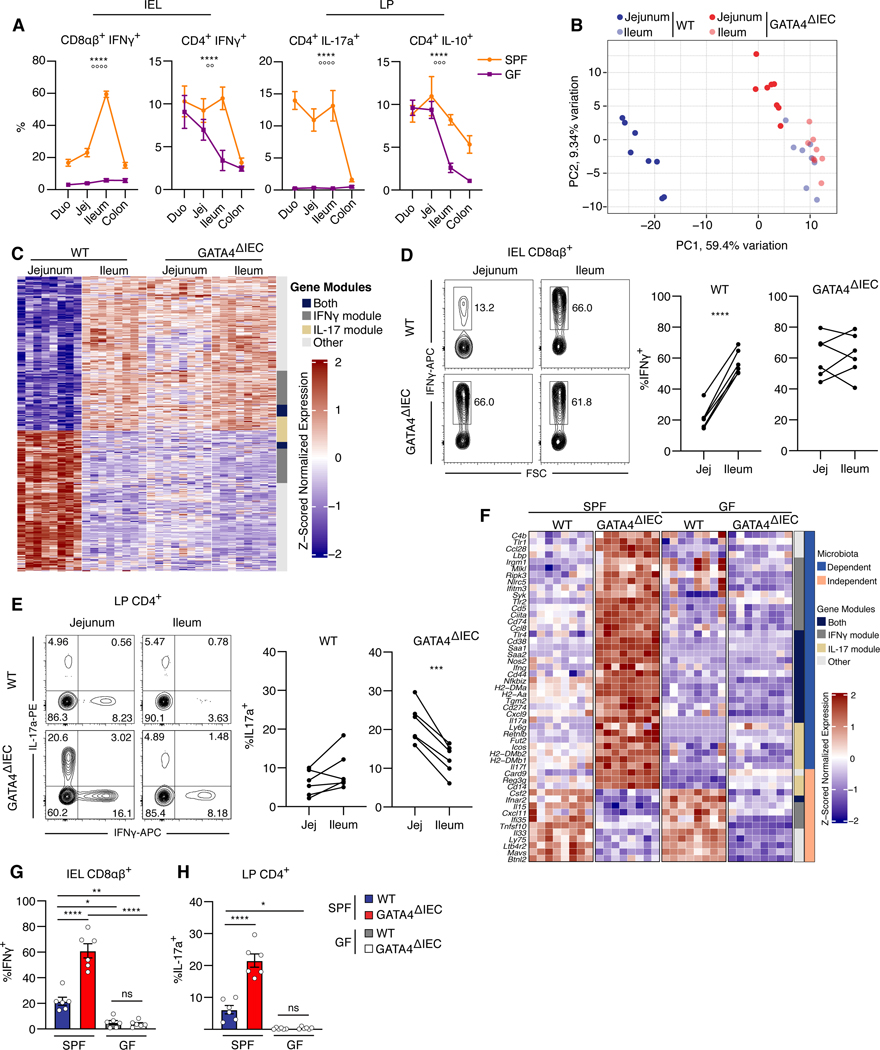
Figure 1. Epithelial GATA4 controls regionalization of tissue immunity in the proximal small intestine.
(A) Percentage of IFNγ+, IL-17a+, or IL-10+ cells among CD4+ or CD8αβ+ T cells from intraepithelial lymphocytes (IEL) or the lamina propria (LP) of each intestinal segment in specific-pathogen-free (SPF) or germ-free (GF) mice. ****, P<0.0001, effect due to region; oooo P<0.0001, ooo P<0.001, oo P< 0.01, effect due to microbiota; two-way ANOVA of microbiota and region impact on cytokine levels. N= 5–7 mice/group.
(B) Tissue samples plotted by the top two principal components (PCs) of the expression of the 500 most variable immune genes as measured by RNA-seq. N= 8 mice/group.
(C) Heatmap of the z-scored expression of region-specific, GATA4-regulated immune genes (rows) in jejunum and ileum tissue samples (columns) of wild-type (WT) and GATA4ΔIEC mice. Of 625 genes, 145 are uniquely in the IFNγ module, 54 are uniquely in the IL-17 module, 39 are in both modules, and 387 are in neither (annotation column). N= 8 mice/group.
(D) Representative (left) and summary (right) plots of the frequencies of IFN-γ+ cells among CD8αβ+ T cells in the IELs. N= 6 mice/group.
(E) Representative (left) and summary (right) plots of the frequencies of IL-17a+ cells among CD4+ T cells in the LP. N= 6 mice/group.
(F) Heatmap of the z-scored expression of 50 selected microbiota-dependent and -independent (right annotation column), region-specific, GATA4-regulated immune genes in jejunum tissue samples from SPF and GF WT and GATA4ΔIEC mice. Gene modules (left annotation column) as in C.
(G, H) Frequency (y axis) of IFNγ+ cells among CD8αβ+ T cells from the IEL (G) or of IL-17a+ cells among CD4+ T cells from the LP (H) in the jejunum of SPF and GF WT and GATA4ΔIEC mice. N= 6 mice/group.
All data in this figure are pooled from at least two independent experiments. **** P<0.0001 , *** P<0.001, ** P<0.01, * P<0.05, paired t-test (D and E), ANOVA with Tukey multiple comparison test (G and H).

