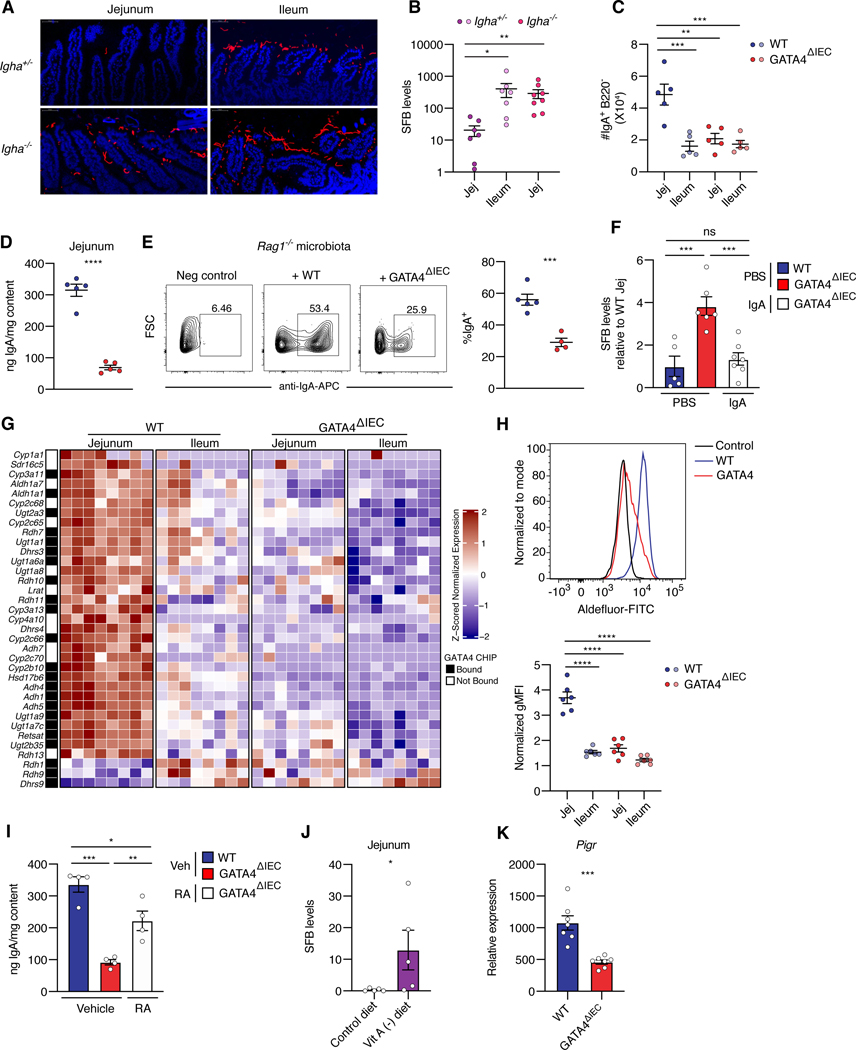
Figure 5. GATA4 regulates regionalization of retinol metabolism and IgA to limit SFB colonization in the proximal intestine.
(A) FISH staining of SFB (Cy5) in monocolonized IgA deficient (Igha−/−) and littermate control (Igha+/−) mice and counterstained with DAPI.
(B) SFB load, as measured by qPCR, in mucosal scrapings from the jejunum and ileum of control (Igha+/−) mice and the jejunum of IgA deficient (Igha−/−) mice. N= 7–8 mice/group.
(C) Number of IgA+ B220− plasma cells, in the jejunum and ileum tissue of WT and GATA4ΔIEC mice. N= 5 mice/group.
(D) Amount of sIgA, as determined by enzyme-linked immunoassay (ELISA), in contents of the jejunum.
(E) Frequency of IgA coated bacteria after staining of Rag1−/− feces with supernatant from WT and GATA4ΔIEC jejunal contents. N= 4–5 mice/group.
(F) SFB loads, in jejunal mucosal scrapings of PBS-treated WT or GATA4ΔIEC mice, and IgAsupplemented GATA4ΔIEC mice. N= 5–7 mice/group.
(G) Heatmap of z-scored expression of region-specific GATA4-regulated genes in the KEGG retinol metabolism pathway, from RNA-seq on epithelial cells. Compared to other genes in the pathway expressed in epithelial samples, these genes are significantly enriched in GATA4-bound promoters, as determined by ChIP-seq (black squares in the annotation column) (Table S1; odds ratio 2.6, P < 0.005; Fisher’s exact test).
(H) Top, representative histogram of ALDH activity by ALDEFLUOR staining in jejunal epithelial cells. WT epithelial cells treated with ALDH inhibitor are shown as negative control for background fluorescence. Bottom, summary plots show the normalized geometric mean fluorescence intensity (gMFI) of ALDEFLUOR staining in epithelial cells from the jejunum and ileum of WT and GATA4ΔIEC mice. N= 6 mice/group.
(I) Total IgA in the jejunal contents of WT, GATA4ΔIEC vehicle-treated, and GATA4ΔIEC RA-treated mice after 14 days. N= 4 mice/group.
(J) SFB loads, in jejunal mucosal scrapings of GF WT mice fed a control or vitamin A deficient diet and subsequently colonized with SFB. N= 5 mice/group.
(K) Pigr expression as measured by qPCR relative to Gapdh, in the jejunum of WT and GATA4ΔIEC mice. N= 7 mice/group.
All data in this figure are pooled from at least two-independent experiments and represented as mean± SEM. **** P<0.0001 , *** P<0.001, ** P<0.01, * P<0.05, Kruskal-Wallis with Dunn multiple comparison test (B), ANOVA with Tukey multiple comparison test (C, F, H, I), t-test (D, E, K), Mann Whitney test (J).

