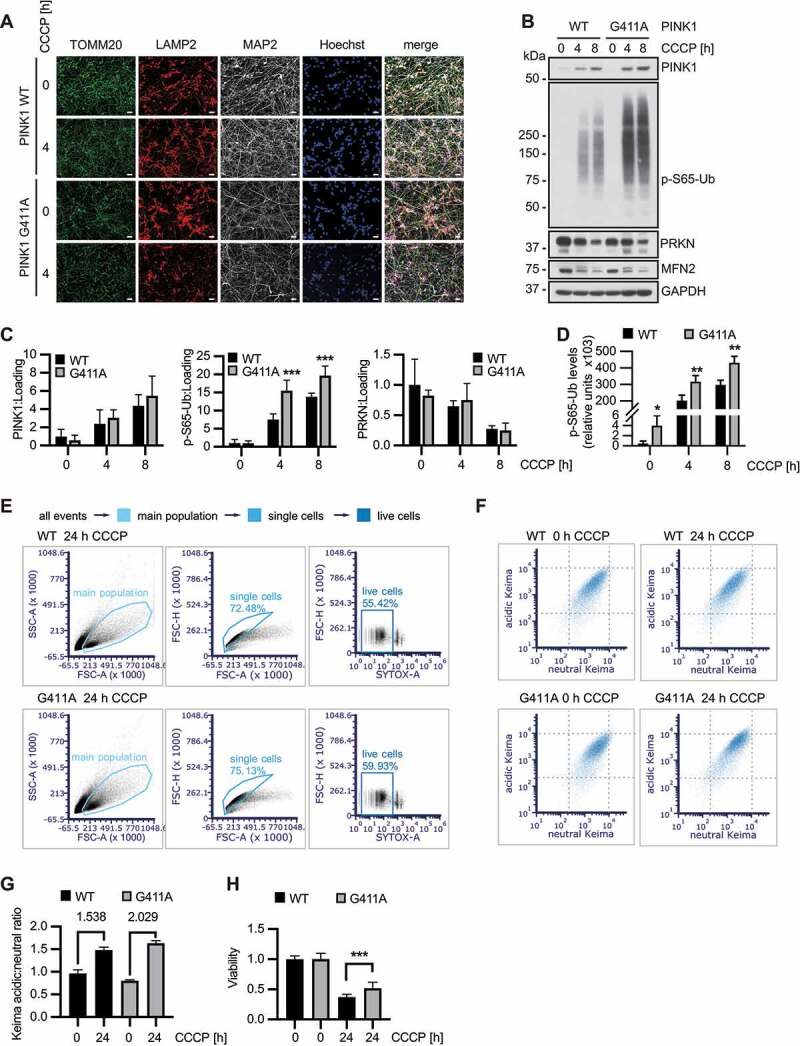
Figure 4.

PINK1G411A variant promotes mitophagy in human neurons. (A) Differentiation of NPCs into neurons leads to neuron-like morphology accompanied by the presence of neuronal marker (MAP2). Mitochondrial and lysosomal morphology and distribution seem unchanged in PINK1G411A versus WT cells also at higher magnification (not shown). Scale bars: 10 µm. (B) Immunoblot analysis of isogenic neurons highlights the stronger induction of p-S65-Ub in PINK1G411A cells compared to parental WT cells. (C) Quantification of signals from four independent experiments as shown in (B) confirms statistically significant increase of p-S65-Ub, but not PINK1 or PRKN levels. (D) Lysates from the same experiments were also used for sandwich ELISA, demonstrating significantly higher p-S65-Ub levels even at basal, non-treated conditions. (E-G) Cells were differentiated and the mitoKeima signal measured by flow cytometry. Doublet and dead SYTOX Red positive cells were excluded from the analysis (E) and the acidic and neutral mitoKeima signal was measured from at least 20,000 cells per experiment (F). The geometric mean of the ratio of acidic to neutral Keima ± SD is shown from three independent experiments (G). PINK1G411A neurons show a greater increase of mitophagy compared to WT. (H) Cells were differentiated in 96-well plates and treated with CCCP to induce mitochondrial damage. Viability was determined using CyQUANT. Overnight incubation led to more cell death in wild-type cells compared to PINK1G411A, which were partially protected (n = 12). (C, D, H) Shown are the means ± SD of independent experiments. Statistical analysis was performed using two-way ANOVA with Sidak’s post-hoc test (C, H) or Student’s two-sided t-test to compare levels at baseline (D) (* p < 0.05, ** p < 0.005, *** p < 0.0005).
