Figure 7.

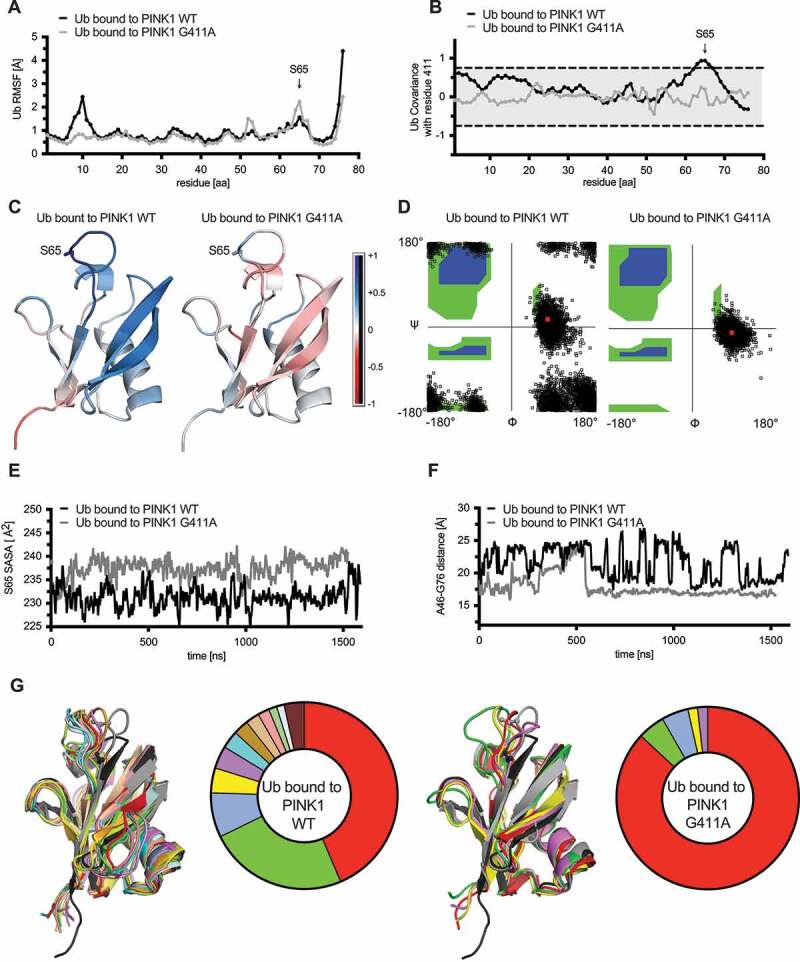
Ub bound to PINK1G411A adopts a C-terminal retracted conformation. (A) RMSF are shown for the substrate Ub bound to either WT PINK1 (black) or PINK1G411A (gray). Residue S65 of Ub is highlighted with an arrow. (B) Analysis of correlated motions between position 411 of PINK1 and all residues within the substrate Ub bound to WT PINK1 (black) or PINK1G411A (gray). (C) Heatmap presentation of correlated motions mapped onto the Ub structures bound to WT PINK1 (left) or PINK1G411A (right) highlights the reduced covariance of Ub in complex with the PINK1 variant. The structures are colored on a five-point covariance scale from dark (−1.0) and light red (−0.5) to white (0) to light (+0.5) and dark blue (+1.0). (D) Shown are distributions of all Ramachandran angles adopted by Gly10 during the simulation of Ub bound to WT PINK1 (left) or PINK1G411A (right). The Ramachandran angles of Gly10 from either the common (1UBQ) or the minor Ub conformation (6EQI) are represented by the red dots almost centered within the clouds observed for WT PINK1 or PINK1G411A, respectively. (E) The solvent accessible surface area (SASA) for S65 was calculated across every frame for the entire simulation of Ub bound to WT PINK1 (black) or PINK1G411A (gray). Shown are the 5 nsec moving average. (F) Proximity measures between Ala46 and Gly76 of Ub bound to WT PINK1 (black) or PINK1G411A (gray). Depicted are the 5 nsec moving average of the distance. (G) Ub conformations were sorted using the Quality Threshold algorithm with heuristically determined RMSD cutoffs to obtain a reasonable number of total clusters, with minimum cluster size approximately 1% of the frames, and rejection rate less than 5%. Shown is an overlay of the center frames of the main clusters for WT PINK1 (left) and PINK1G411A (right) together with the common Ub conformation (1UBQ) in black and the minor Ub-CR structure (6EQI) in gray. Ser65 is shown in ball and stick model for these structures as a reference point. The center frame of each unique cluster was subjected to energetics calculation using FoldX and the raw score was weighted by the percentage of frames represented by that particular cluster. The color-matched pie chart depicts the frequencies of each cluster. The respective raw and weighted ΔG values of the interaction between PINK1 and Ub from each cluster can be found in Table S2.
