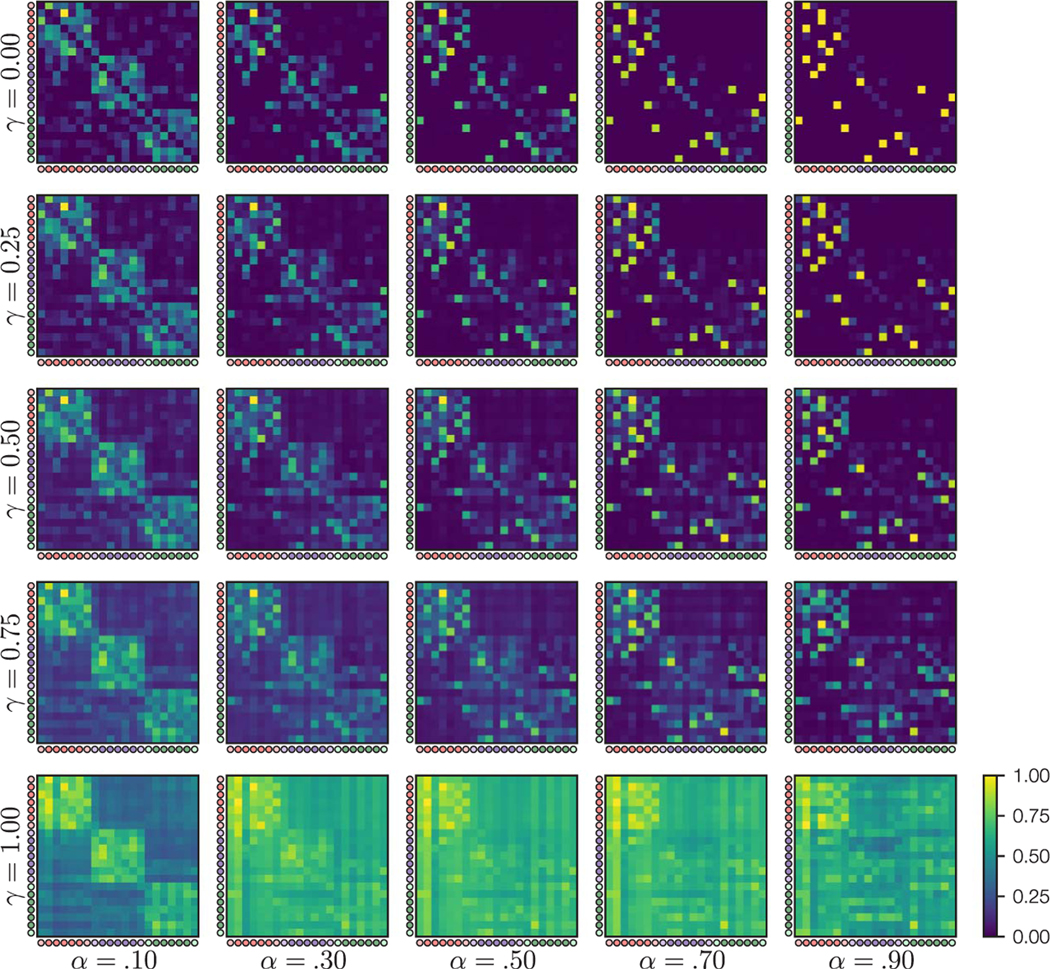
Figure 3.

SRs after learning given different values of the and parameters, after simulation of the object sequences viewed by an example participant. Within each SR, each row shows the expected count of future object presentations, discounted based on the discounting factor , for a given starting object. Circles indicate the object community (red, purple, green) and whether each object is a central node (dark) or boundary node (light). For display purposes, each matrix was divided by the maximum value in that matrix. We found that the clearest learning of the community structure appeared for relatively low values of and relatively high values of .
