Figure 5.
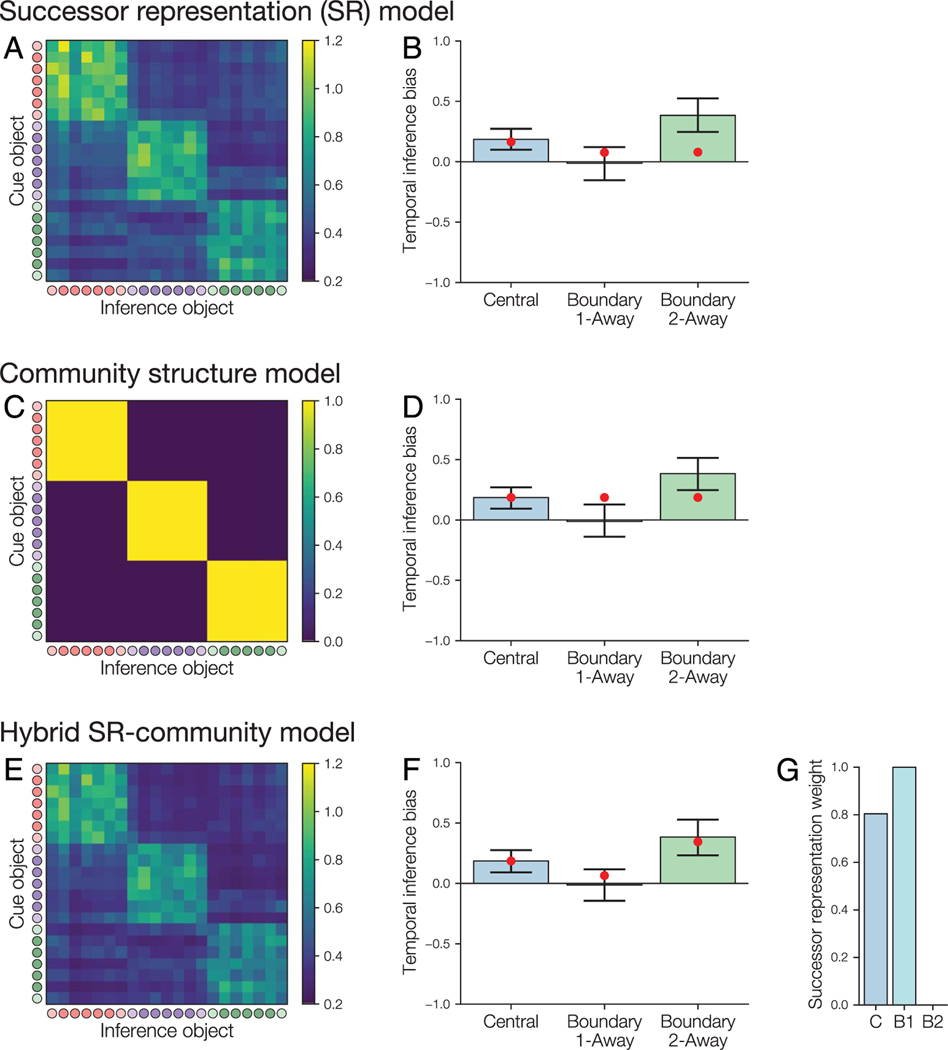
Models of inductive inference task performance based on learned similarity of object pairs. (A–B) SR matrix and model fit to inference behavior. (A) SR matrix after learning for one example participant (the same participant as in Figure 3) based on the object sequences that they observed, with a learning rate of 0.1 and best-fitting discounting factor of 1.0. The matrix shows the expected temporally discounted frequency of visiting each inference object after viewing the cue object. Circles indicate the object community (red, purple, green) and whether each object is a central node (dark) or boundary node (light). (B) Fit of the SR model to average temporal bias for each inference test type. Bars show observed performance (with bootstrap 95% confidence intervals); red dots show model estimates. The model incorrectly predicts that temporal bias should be low on the boundary 2-away trials. (C–D) Within-community similarity model. (C) Model association matrix. Objects in the same community have a similarity of one, and objects in different communities have a similarity of zero. (D) The model incorrectly predicts that there will be equal bias for each trial type. (E–G) Hybrid SR-community model. The hybrid model simulates inference as being influenced by a weighted combination of SR and within-community similarity. (E) SR matrix for the same example participant as in (A), with the best-fitting discounting factor of 0.974. (F) The hybrid model correctly fits the differences in temporal bias between the trial types. (G) Based on the model fit, the central and boundary 1-away inference trials weight the SR more heavily, whereas the boundary 2-away trials weight only the within-community similarity matrix. C = central; B1 = boundary 1-away; B2 = boundary 2-away.

