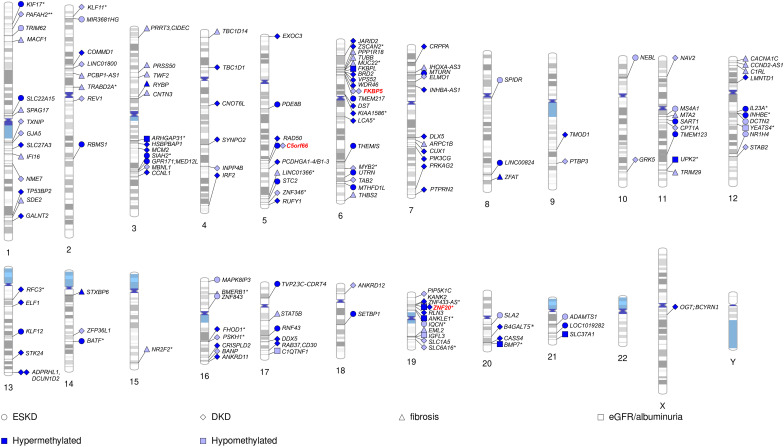
Figure 2.
Chromosomal ideogram including CpGs methylation associated with kidney disease (DKD and ESKD), fibrosis, eGFR, or albuminuria in diabetes. For intergenic CpGs (*), the nearest gene is given. Hypermethylated CpGs (in kidney disease vs. controls) are denoted by a dark blue colour and hypomethylated by a light blue colour. CpGs appearing among top loci in multiple studies on kidney disease in diabetes denoted by a red color.

