
Fig. 1 –
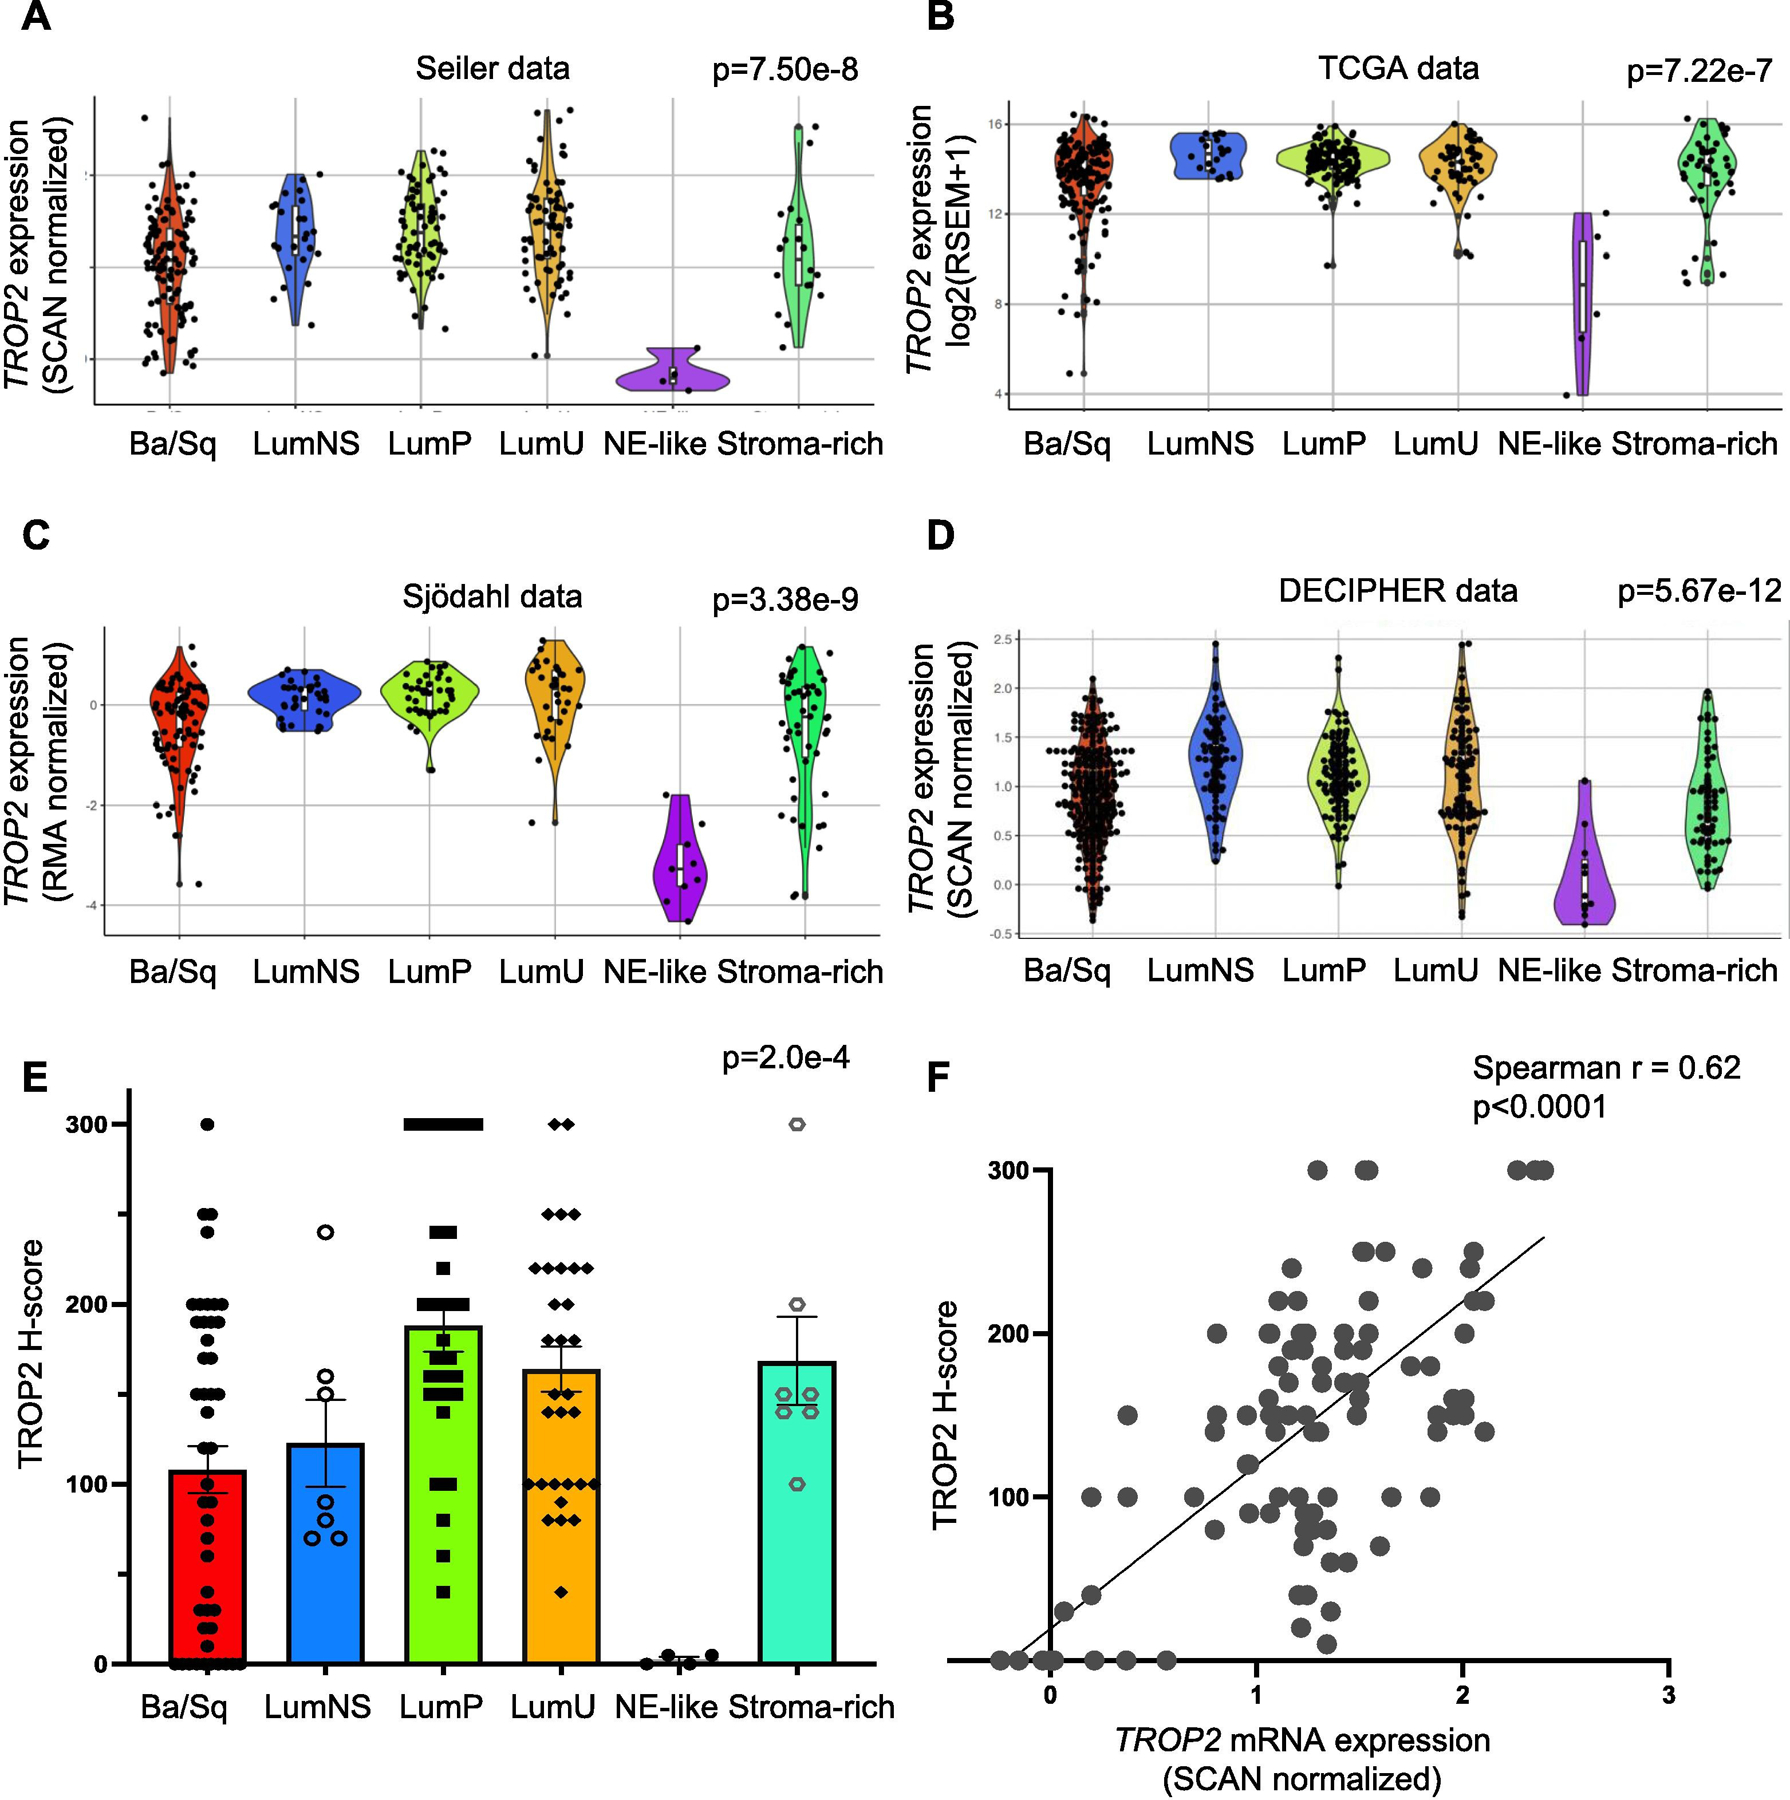
TROP2 mRNA and TROP2 protein expression across the molecular subtypes of muscle-invasive bladder cancer (MIBC). Violin plots showing TROP2 mRNA expression levels by consensus molecular subtypes in the (A) Seiler, (B) TCGA, (C) Sjödahl, and (D) Decipher cohorts. (E) Immunohistochemistry for TROP2 was performed using a bladder cancer TMA (n = 80 samples, in duplicate). H scores for TROP2 were assigned in a blinded manner, and subtypes were determined previously. The average TROP2 H score ± SEM is shown for each subtype. The p value from Kruskal-Wallis testing is shown for each cohort in panels A–E. (F) Scatter plot showing the correlation between TROP2 protein (H score) and TROP2 mRNA expression levels. The Spearman’s rho coefficient is shown (p < 0.0001). Ba/Sq = basal/Squamous; LumNS = luminal nonspecified; LumP = luminal papillary; LumU = luminal unstable; NE = neuroendocrine; SEM = standard error of the mean; TCGA = The Cancer Genome Atlas; TMA = tissue microarray.