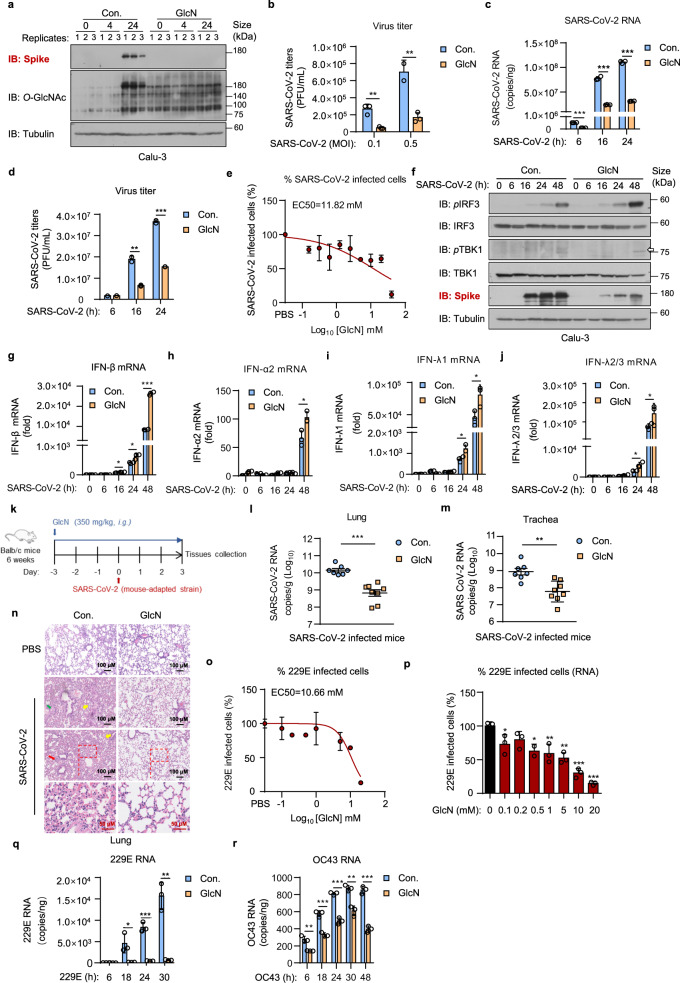
Fig. 1.
GlcN enhances SARS-CoV-2 induced IFNs signaling and exhibits a broad-spectrum antiviral activity against multiple HCoVs. a Calu-3 cells were treated with GlcN for 3 h at 20 mM, infected with SARS-CoV-2 (MOI = 1) for 4 and 24 h. Immunoblotting of SARS-CoV-2 spike and O-GlcNAcylation level were performed. b Calu-3 cells were treated with GlcN for 3 h at 20 mM, infected with SARS-CoV-2 at an MOI of 0.1 or 0.5. Infectious supernatant was collected at 24 h post infection. Virus titers were measured. c, d Calu-3 cells were treated with GlcN for 3 h at 20 mM, infected with SARS-CoV-2 (MOI = 1) for 6, 16 and 24 h. Analysis of SARS CoV-2 RNA level in cells c, virus titer in supernatant d were performed. e Calu-3 cells were treated with GlcN ranging from 0.1 to 40 mM for 3 h, infected with SARS-CoV-2 (MOI = 1) for 24 h. Cells were stained for the SARS-CoV-2 N protein and imaged. The percentage of SARS-CoV-2 staining was quantified as shown. f–j Calu-3 cells were treated with GlcN for 3 h at 20 mM, infected with SARS-CoV-2 for 6, 16, 24, and 48 h. Immunoblotting of SARS-CoV-2 spike, phosphorylated IRF3 and TBK1 were performed f. qRT-PCR analysis of IFN-β g, IFN-α2 h, IFN-λ1 i, and IFN-λ2/3 j expression was performed. The virus titer of SARS-CoV-2 used in (a, c, d, f–j) was 3.5 × 10⁶ PFU/mL, used in b, e was 1.73 × 10⁶ PFU/mL. k Schematic diagram of the mice experiment. 6 weeks old Balb/c mice were intragastric administration of GlcN (350 mg/kg) for 3 days. Mice were infected with SARS-CoV-2 strain MASCp6 intranasally. Infection for 3 days, mice were sacrificed and tissues were collected. l, m mice were treated as k. qRT-PCR analysis of SARS-CoV-2 RNA level in lung l and trachea m sections were performed. n H&E-stained analysis showing inflammatory cell infiltration (red arrow), alveolar septal thickening (yellow arrow) and fibrin exudation (green arrow) in lungs from mice treated as k. The virus titer of SARS-CoV-2 used in l–n was 4 × 10⁵ PFU/mL. o, p Calu-3 cells were treated with GlcN ranging from 0.1 to 20 mM for 3 h, infected with 229E (1 × 10⁷ PFU/mL) at an MOI of 1 for 24 h. RNA and infectious supernatant were collected. Dose-response curves of GlcN is shown and EC50 is indicated above the curve o. The percentage of 229E infection calculated by viral RNA is shown as indicated p. q, r Calu-3 cells were treated with GlcN for 3 h at 20 mM, infected with 229E or OC43 at an MOI of 1 for 6, 18, 24, 30 h. qRT-PCR analysis of 229E q and OC43 r RNA expression was performed. qRT-PCR results are presented relative to those of GAPDH g–j. Data were shown as means ± SEM l, m, means ± SD b–e, g–j, o–r from triplicates (biological replicates), *p < 0.05, **p < 0.01, and ***p < 0.001 (two-tailed Student’s t test)

