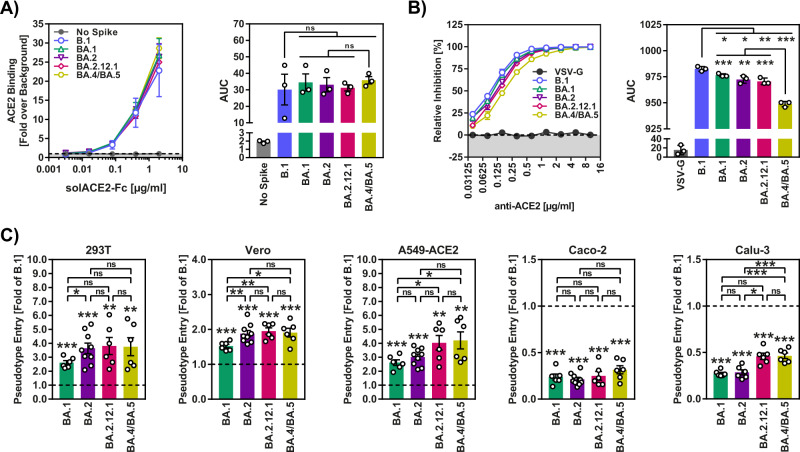
Fig. 2. Increased virus-cell fusion driven by the S protein of BA.2.12.1 and BA.4/BA.5.
A Efficiency of ACE2 binding. Left: 293T cells transiently expressing the indicated S proteins (or no S protein) were incubated with the indicated concentrations of soluble ACE2 harboring a C-terminal Fc-tag (derived from human immunoglobulin G; solACE2-Fc) and then incubated with an AlexaFluor-488-coupled secondary antibody. Subsequently, ACE2 binding was analyzed by flow cytometry and normalized against the assay background (signals for samples without soluble ACE2, set as 1). Right: Area under the curve (AUC) data for ACE2 binding. Both panels show average (mean) data ± SEM from three biological replicates (each with single samples). Please also see Supplementary Fig. 1. B Impact of ACE2 blockade on S protein-driven cell entry. Left: Vero cells were preincubated with different concentrations of anti-ACE2 antibody and subsequently inoculated with pseudoviruses bearing the indicated S proteins or VSV-G (or no S protein). Cell entry was assessed by measuring the activity of pseudovirus-encoded firefly luciferase in cell lysates at 16–18 h after inoculation and normalized against samples that were not exposed to anti-ACE2 antibody (set as 0% inhibition). Right: AUC data for ACE2 blockade. Both panels show average (mean) data ± SEM from three biological replicates (each with four technical replicates). C Cell entry mediated by S proteins. Cell entry was assessed by measuring the activity of pseudovirus-encoded firefly luciferase in cell lysates at 16–18 h after inoculation of cells with particles containing the indicated S proteins (or no S protein). The average (mean) data ± SEM from 6 to 12 biological replicates (each with four technical replicates) are presented, with entry standardized against B.1 (set as 1). Please also see Supplementary Fig. 2. For all panels statistical significance was analyzed by two-tailed Student’s t-tests with Welch correction (p > 0.05, not significant [ns]; p ≤ 0.05, *; p ≤ 0.01, **; p ≤ 0.001, ***), see also Extended Data Table 2. AUC area under the curve.

