Fig. 2.
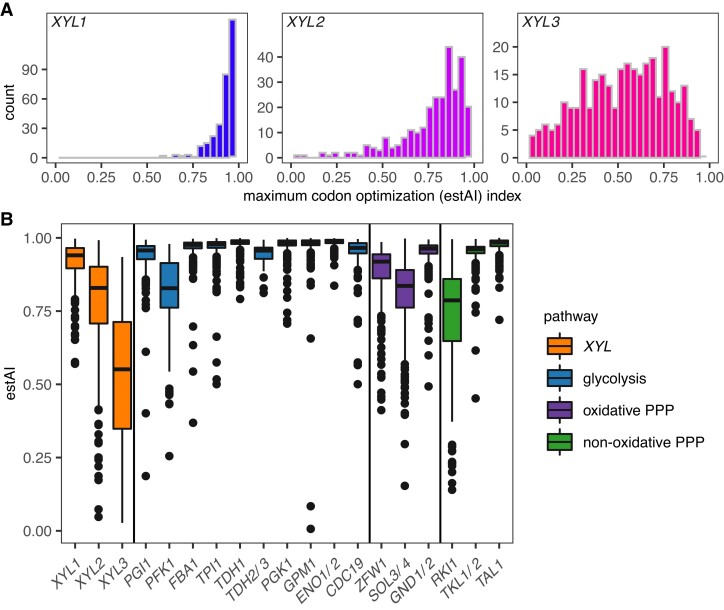
Distribution of codon optimization indices (estAI values). (A) Histograms of the distribution of maximum estAI values among 320 of the 325 species for XYL1, XYL2, and XYL3 are shown. XYL1 genes were skewed towards highly optimized (blue), XYL2 estAI values were somewhat less skewed (violet), and XYL3 estAI values were broadly distributed (magenta). Median estAI values of 0.94, 0.83, and 0.55 were calculated for XYL1, XYL2, and XYL3, respectively. (B) XYL gene estAI distributions were compared with other carbon metabolism pathways related to xylose metabolism. The XYL pathway (orange), in general, was less optimized than glycolysis (blue) or either branch of the PPP (purple/green). Specifically, the XYL1 distribution was significantly lower than the estAI distributions of highly expressed glycolytic genes (FBA1, TPI1, TDH1, PGK1, GPM1, and ENO1/ENO2), but it was similar to PGI1. XYL2 genes had estAI values similar to the rate-limiting steps in glycolysis (PFK1) and the oxidative PPP (ZWF1). XYL3 was less optimized on average than genes involved in glycolysis or the PPP.

