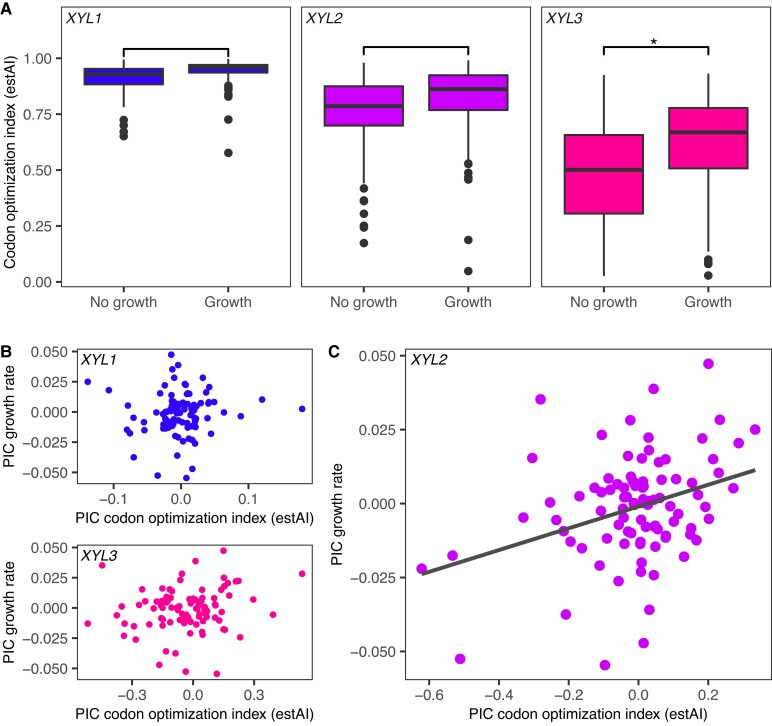
Fig. 3.
XYL3 codon optimization predicts the ability to metabolize xylose. (A) Boxplots showing the distribution of estAI values for species unable to use xylose (left) compared with those that can (right) for XYL1 (blue), XYL2 (violet), and XYL3 (magenta). Asterisk denotes significant as assessed by a Bayesian phylogenetic linear mixed model (GLMM) (supplementary table S4, Supplementary Material online). (B, C) PIC analyses of XYL1, XYL2, and XYL3 estAI in relation to xylose growth. Kodamaea laetipori and Blastobotrys adeninivorans were removed as outliers prior to analyses. (B) Codon optimizations of XYL1 and XYL3 did not correlate with xylose growth rates. (C) Codon optimization of XYL2 was significantly correlated with growth rate in xylose medium (P = 9 × 10⁻⁴, r = 0.34).

