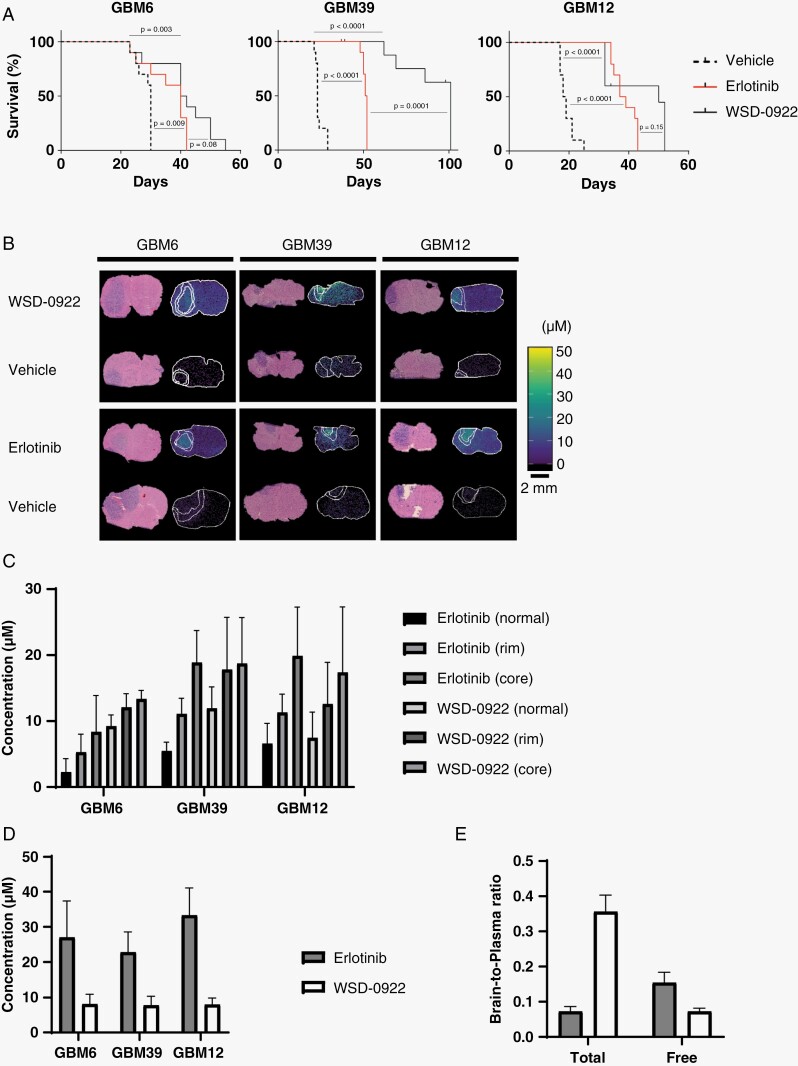
Figure 3.
WSD-0922 prolongs survival in the GBM39 intracranial mouse model. (A) Kaplan–Meier curves showing the long-term survival of intracranial PDX mice after recurring treatment with the indicated drugs. The x-axis represents survival from tumor implantation until moribund. For GBM39, remaining WSD-0922 treated mice were euthanized at the 100 day mark. (B) Representative MALDI-MS images showing drug measured in the intracranial tumor and surrounding regions. Images are accompanied by corresponding H&E staining. (C) Quantification of measured drug levels in the tumor core and rim, and surrounding normal tissue of the MALDI-MSI images in (B). (D) The concentration of drug in the plasma of each mouse was measured as described in 2C. (E) Brain-to-plasma and unbound brain-to-plasma concentration ratios were determined for GBM12 intracranial mice using the plasma levels in (D) and drug concentrations measured in the normal brain.

