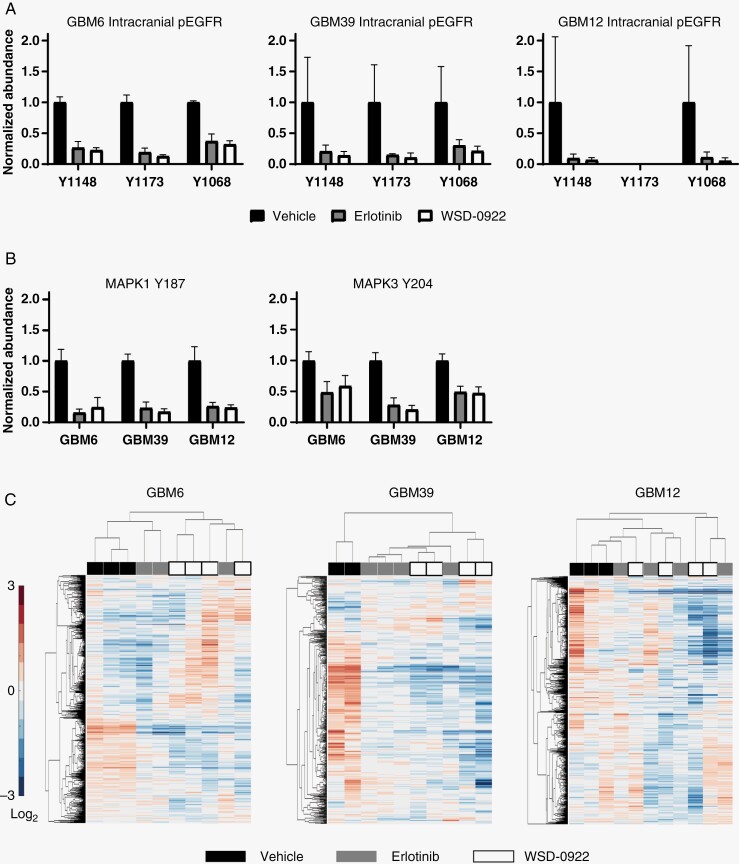
Figure 4.
Evaluating the effect of WSD-0922 on intracranial epidermal growth factor receptor (EGFR) signaling. (A) Phosphoproteomics was used to measure the inhibition of EGFR peptide phosphorylation in intracranial tumors, as in 2D. Tyr 1173 pEGFR data were not included for GBM12 because TMT reporter ions for this phosphorylation event were below the mass spectrometer limit of detection in runs performed for these samples. (B) pERK1/2 levels were measured as in (A). (C) Heatmaps showing the hierarchical clustering of tumor samples (columns) and phosphopeptides (rows). Heatmaps reflect changes in the relative abundance of tyrosine-phosphorylated peptides in response to the indicated treatments. Values are shown as log2-fold changes over the mean abundance across all conditions for a given phosphopeptide.

