Fig. 1.
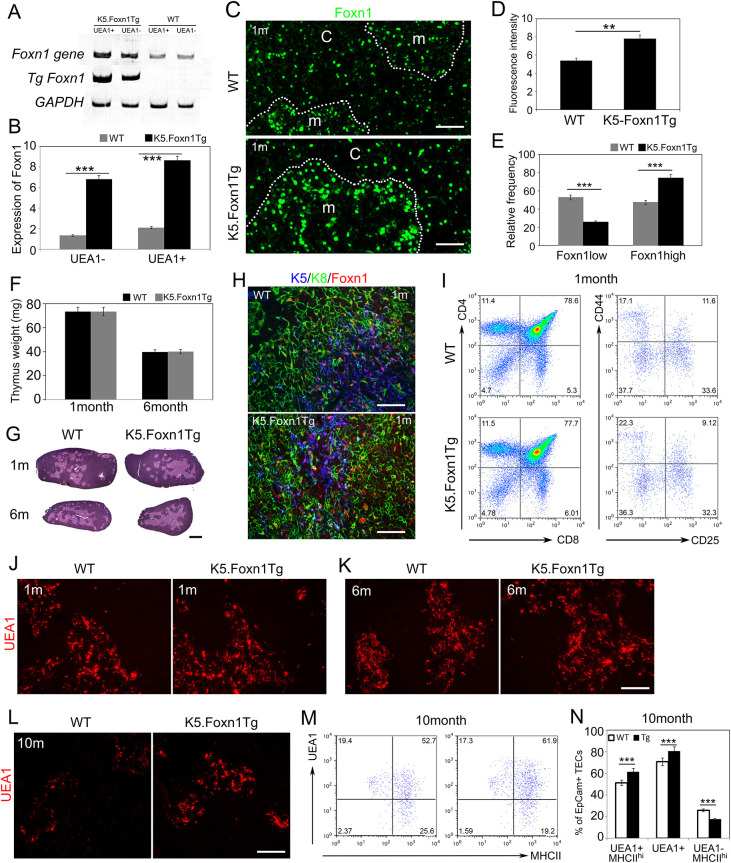
Expression and phenotypes of K5.Foxn1 in a wild-type background. The K5.Foxn1 transgene is indicated in all figures as ‘Tg+’. All ages are 1 month unless otherwise indicated on the figure panels. (A) RT-PCR of endogenous- and Tg-expressed Foxn1 in thymic epithelial cells. (B) RT-PCR analysis of total Foxn1 expression in sorted TEC subsets from wild-type and K5.Foxn1 thymi. ***P<0.005 (n=5). (C) Paraffin sections from wild-type and K5.Foxn1Tg+ mice stained with a FOXN1 antibody (green). Dotted lines delineate medulla (m) and cortex (C). (D) Quantification of fluorescence intensity of FOXN1 in K5.Foxn1 transgenic thymus. **P<0.01 (n=10). (E) Relative frequency of FOXN1hi cells is increased in K5.Foxn1 TECs. ***P<0.005 (n=10). (F) Thymus wet weight in K5.Foxn1 Tg+ and wild-type mice. (G) Hematoxylin & Eosin-stained paraffin sections of thymi from K5.Foxn1Tg+ and WT mice. (H) IHC of K8 (green), K5 (blue) and FOXN1 (red) on K5.Foxn1Tg+ and WT thymi. (I) FACS profiles of CD4, CD8, CD25 and CD44 expression in K5.Foxn1Tg+ and wild-type thymocytes (n=11). (J-L) Fluorescent immunostaining of UEA-1 on 1- (J), 6- (K), and 10-month-old (L) K5.Foxn1Tg+ and wild-type thymi. (M,N) Flow cytometric analysis of UEA-1 shows increased density and percentage of UEA-1+ TECs in K5.Foxn1Tg mouse thymus compared with wild type. ***P<0.005 (n=6). Statistical analyses were carried out using one-way Student's t-test. Data are mean±s.e.m. Scale bars: 100 µm. All paired images are shown at same magnification. WT, wild type.

