Fig. 5.
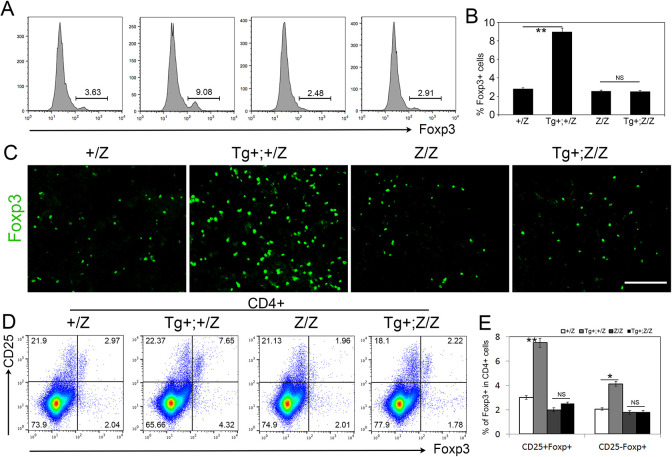
Regulatory T cells increase in K5.Foxn1 thymus but not in K5.Foxn1;Foxn1Z/Z mutants. (A) FOXP3 in gated CD45+ thymocytes. (B) The percentage of FOXP3+ cells in gated CD45+ thymocytes. **P<0.01 (n=8). (C) Immunostaining for FOXP3 on paraffin sections of thymus. (D) Profile of CD25 and FOXP3 expression in gated CD4+ thymocytes. (E) The percentage of FOXP3+ cell in gated CD4+ thymocytes. *P<0.05, **P<0.01 (n=8). Statistical analyses were carried out using one-way ANOVA with multiple comparison testing. Data are mean±s.e.m. NS, not significant. Scale bar: 100 µm. All paired images are shown at same magnification.

