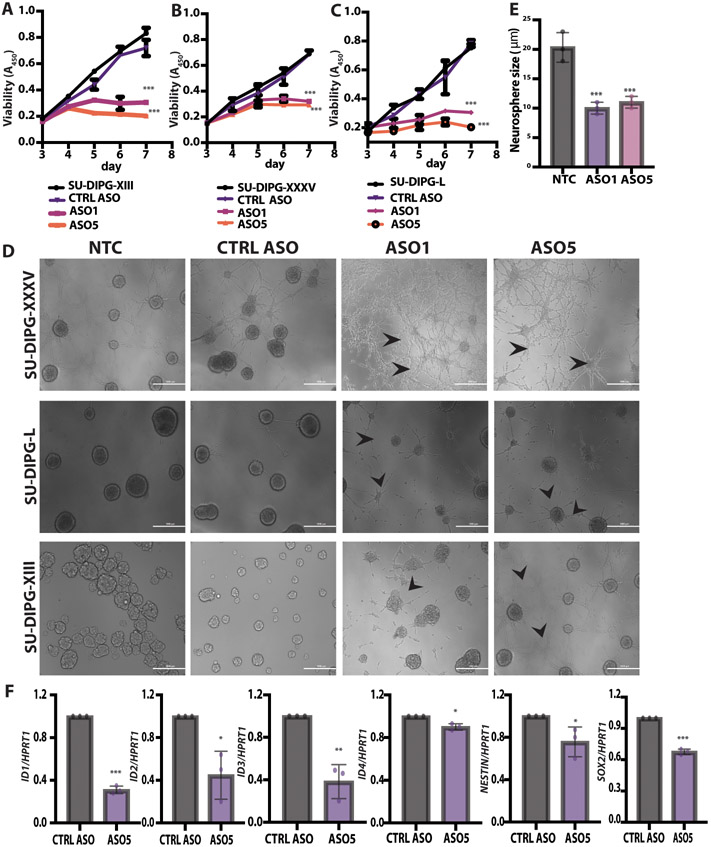
Fig. 2. ASO-mediated H3.3K27M depletion delayed neurosphere growth and changed cell morphology.
(A) Shown are cell-viability assays at each time point for the SU-DIPG-XIII H3.3K27M cell line (N = 3); (B) Shown are cell-viability assays at each time point for SU-DIPG-XXXV cell line; (C) Shown are cell-viability assays at each time point for SU-DIPG-L cell line; (D) Representative images of SU-DIPG-XIII, SU-DIPG-XXXV, and SU-DIPG-L patient cells treated with ASO1, ASO5, or control Scramble ASO by free uptake for 5 days. Arrowheads indicate neurite-like processes. Scale bars, 1000 μm; (E) Quantification of average neurosphere size (in μm) from the images in (D) (n = 3 random fields); (F) Real time RT-PCR (n = 3) of genes implicated in developmental processes in ASO-5 treated SU-DIPG-XIII cells, relative to expression of control HPRT1. For viability assays, P-values were adjusted for multiple comparisons by controlling family-wise error rate using the single-step method. For neurosphere size, the measurements for each experimental group/treatment were analyzed by ANOVA, followed by pairwise comparisons using two-sample t-tests. Data are presented as means ± SEM. ***P < 0.001, **P < 0.01, *P < 0.05.

