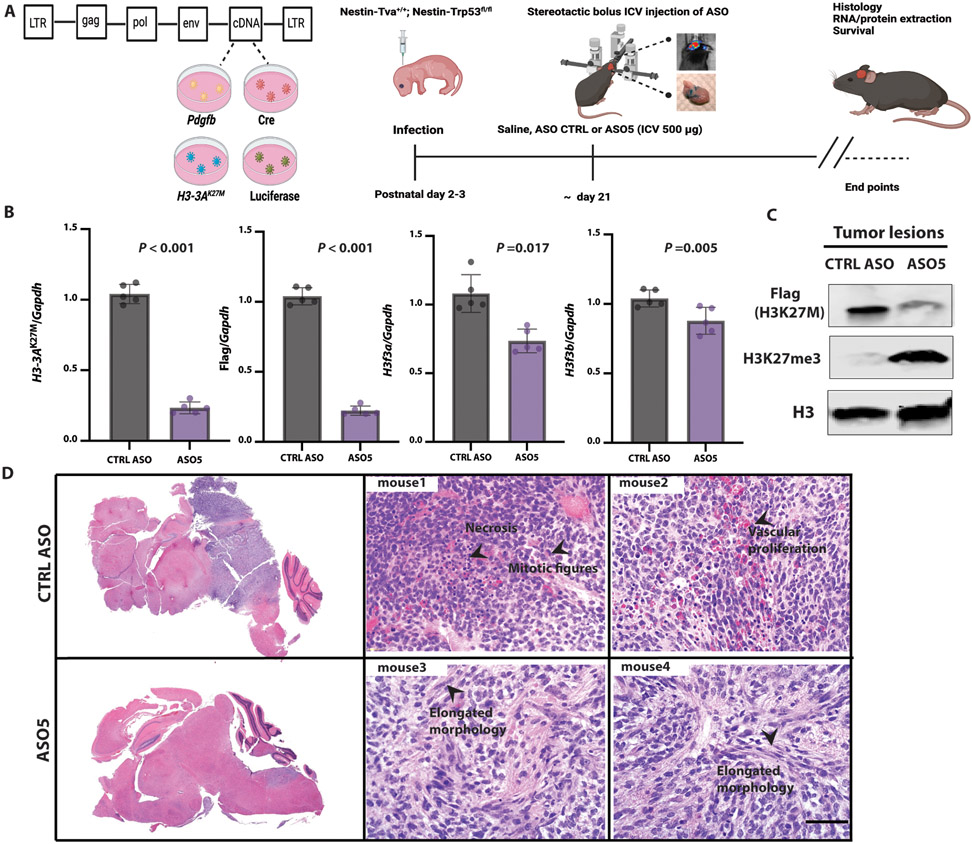
Fig. 3. ICV administration of ASO at the time of tumor onset in the RCAS-Tva mouse model.
(A) Diagram of RCAS plasmids; 105 RCAS-Pdgfb, RCAS-Cre, and RCAS-H3-3AK27M cDNA-expressing producer chicken cells (DF1) were injected into the brainstem of Nestin-Tva; P53fl/fl mice at postnatal day 3 (P3); a single dose (500 μg) of lead ASO or CTRL ASO in saline was stereotactically injected ICV at P21; RNA, protein, and histology samples were collected at the end points when the mice were symptomatic, including an enlarged head, ataxia, or >25% weight loss; (B) Summary data of mRNA expression of H3-3AK27M allele, flag tag, endogenous murine H3f3a and H3f3b as compared to Gapdh (N = 5); (C) Immunoblot of acid-extracted histones from two representative mice; quantification of average band intensities is shown below each band; (D) Representative H&E-stained tumors confirming their location in the midline region of the brain (top left, CTRL ASO-treated; bottom left, ASO5-treated); representative H&E-stained high-grade tumors from control-ASO-treated mice (top, middle and right) and lower-grade tumors with elongated morphology from ASO5-treated mice (bottom, middle and right); scale bar, 500 μm (N = 5). For RT-qPCR experiments, the measurements for each experimental group/treatment were analyzed by Welch’s two-sample t-test to compare the H3-3AK27M expression normalized to the Gapdh loading control between CTRL ASO and ASO5 treatments. Data are presented as means ± SEM.

