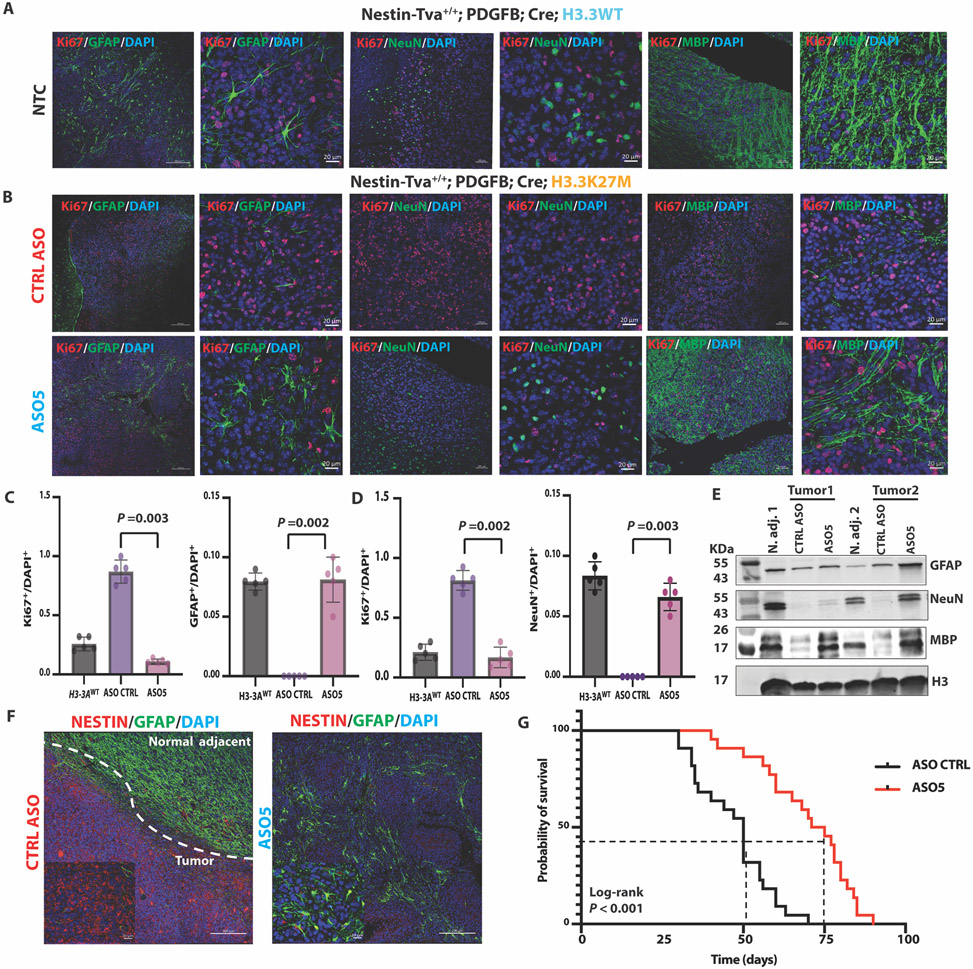
Fig. 4. ASO-mediated H3.3K27M depletion induced astrocyte, neuron, and oligodendrocyte differentiation, decreased tumor cell proliferation and the NESTIN+ cell population, and extended the latency of tumor growth in the Nestin-Tva mouse model.
(A) Representative IF images of no-treatment control (NTC) tumors stained for markers of differentiation (GFAP, NeuN, MBP; green) or proliferation (Ki67; red), and for nuclei with DAPI (blue) in Nestin-Tva mice transduced with H3-3AWT cDNA; (low-magnification images: scale bar, 200 μm; high-magnification images: scale bar, 20 μm); (B) Representative IF images of tumor sections from control (CTRL) ASO-treated (top panels) and ASO5-treated (bottom panels) mice; IF and DAPI staining, and magnification bars are as in (A); (C) Summary data from (A) and (B) of Ki67+ and GFAP+ cell numbers normalized to DAPI+ nuclei for each treatment group (n = 5 random fields); (D) Same as (C) but for Ki67+ and NeuN+ cells; (E) Immunoblot of differentiation markers (GFAP, NeuN, and MBP) in samples prepared from normal adjacent tissue and tumor lesions for each treatment group of mice; (F) Representative IF images showing NESTIN+ cells (red) and GFAP+ cells (green) in CTRL ASO-treated tumor and normal-adjacent tissue (left) and ASO5-treated tumor lesion (right); DAPI staining shows nuclei (blue); magnification-scale bars are as in (A); (G) Kaplan-Meier survival analysis of mouse cohorts following CTRL ASO treatment (N = 22) or ASO5 treatment (N = 21). Cell counts were analyzed by ANOVA, followed by t-tests for the pairwise comparisons, and data are presented as means ± SEM. Probability of survival was compared using log-rank survival estimate.

