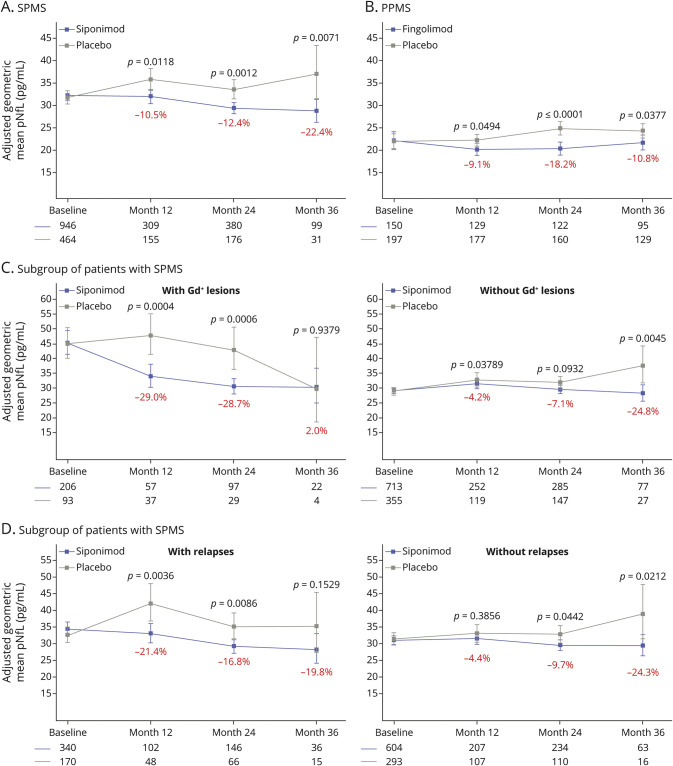
Figure 3. Treatment Effects of Siponimod and Fingolimod on pNfL Levels Over Time in EXPAND (SPMS), INFORMS (PPMS), and Subgroups of Patients With SPMS With or Without Gd+ Lesions and With or Without Relapses.
Treatment effects of siponimod and fingolimod on plasma neurofilament light (pNfL) levels over time in (A) EXPAND (secondary progressive multiple sclerosis [SPMS]), (B) INFORMS (primary progressive multiple sclerosis [PPMS]), (C) a subgroup of patients with SPMS with or without gadolinium-enhancing (Gd+) lesions, and (D) a subgroup of patients with SPMS with or without relapses. In EXPAND, pNfL data at months 12, 24, and 36 were derived from remapping of pNfL data collected at end of treatment/end of study using visit windows (eTable 1, links.lww.com/WNL/B920). The adjusted geometric means and 95 CIs are based on repeated-measurements models for normally distributed data. The model includes the explanatory variables visit, treatment, sex, age, multiple sclerosis (MS) disease duration, prior use of MS medication, baseline Expanded Disability Status Scale score, baseline T2 lesion volume, presence of Gd+ T1 lesions at baseline, superimposed relapses in 2 years prior to study (only applies to SPMS population), baseline log(NfL), and interactions visit × treatment and visit × baseline log(NfL). The percentages represent the relative difference of the siponimod effect compared with the placebo effect.

