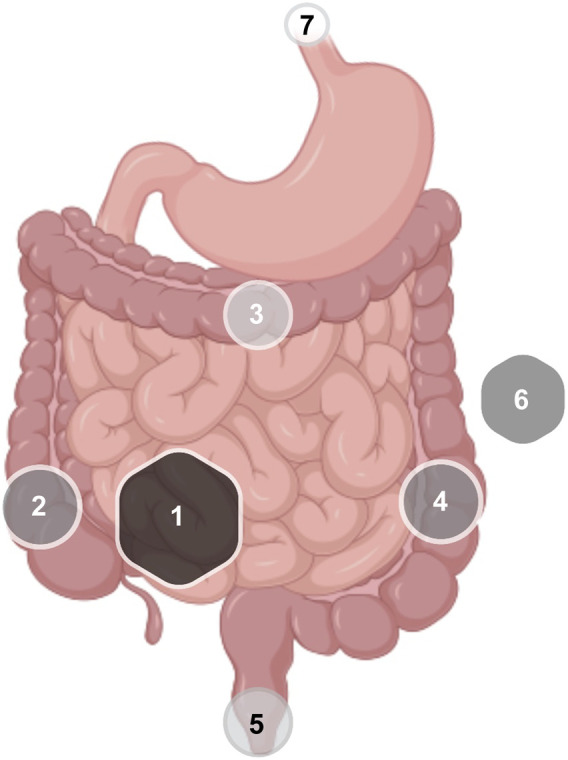
FIGURE 3.

Frequency of distribution of GI inflammatory lesions in IBD associated with anti-CD20 therapies. Frequency was proportional to the diameter of the geometric figure: 1: Terminal ileum; 2: ascending colon; 3: transverse colon; 4: descending colon; 5: rectal-anal; 6: pancolitis; 7: esophagus (GI: gastrointestinal; IBD: intestinal bowel disease).
