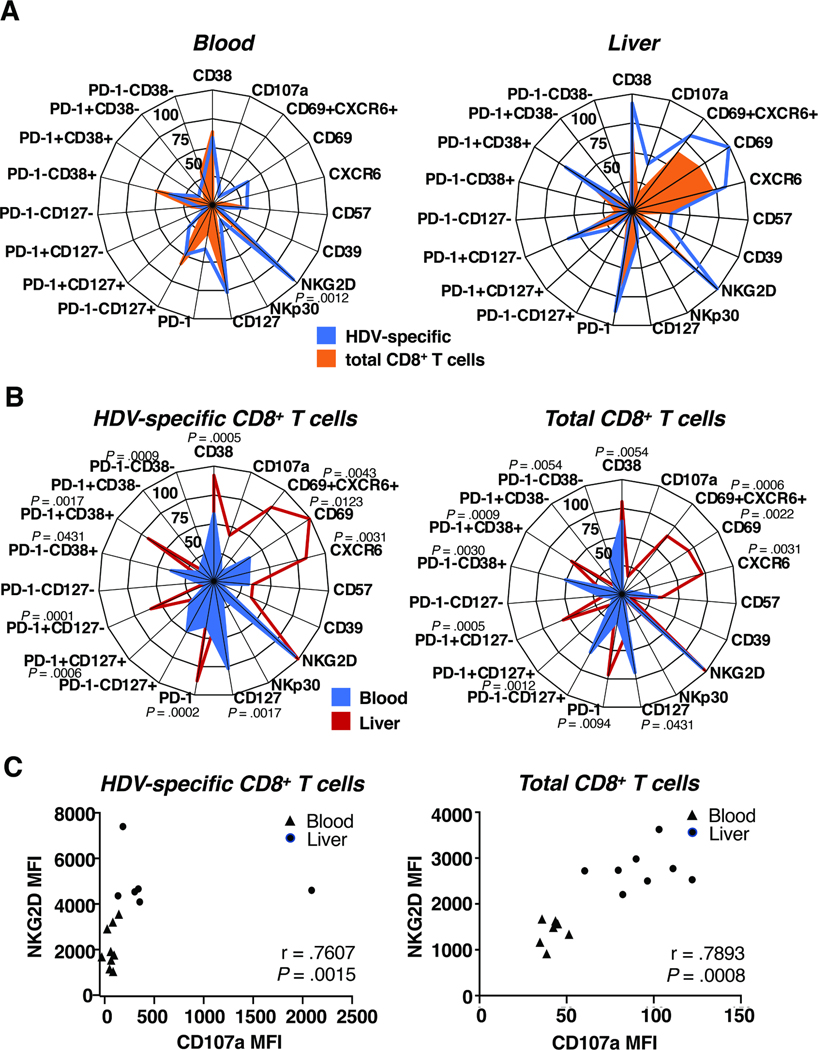
Fig. 4: The liver microenvironment affects the phenotype of HDV-specific and total CD8+ T cells.
(A, B) Radar plots depicting the median frequency of subsets of HDV-specific and total CD8+ T cells in paired blood samples and liver biopsies of HDV-infected patients based on their localization (A) and antigen specificity (B) (raw data shown in Suppl. Fig. 5, 6). Statistics: Friedman test with Dunn’s multiple comparisons test.
(C) Spearman correlation between the NKG2D and CD107a median fluorescence intensity (MFI) on HDV-specific (left) and total CD8+ T cells (right).

