
Figure 4.
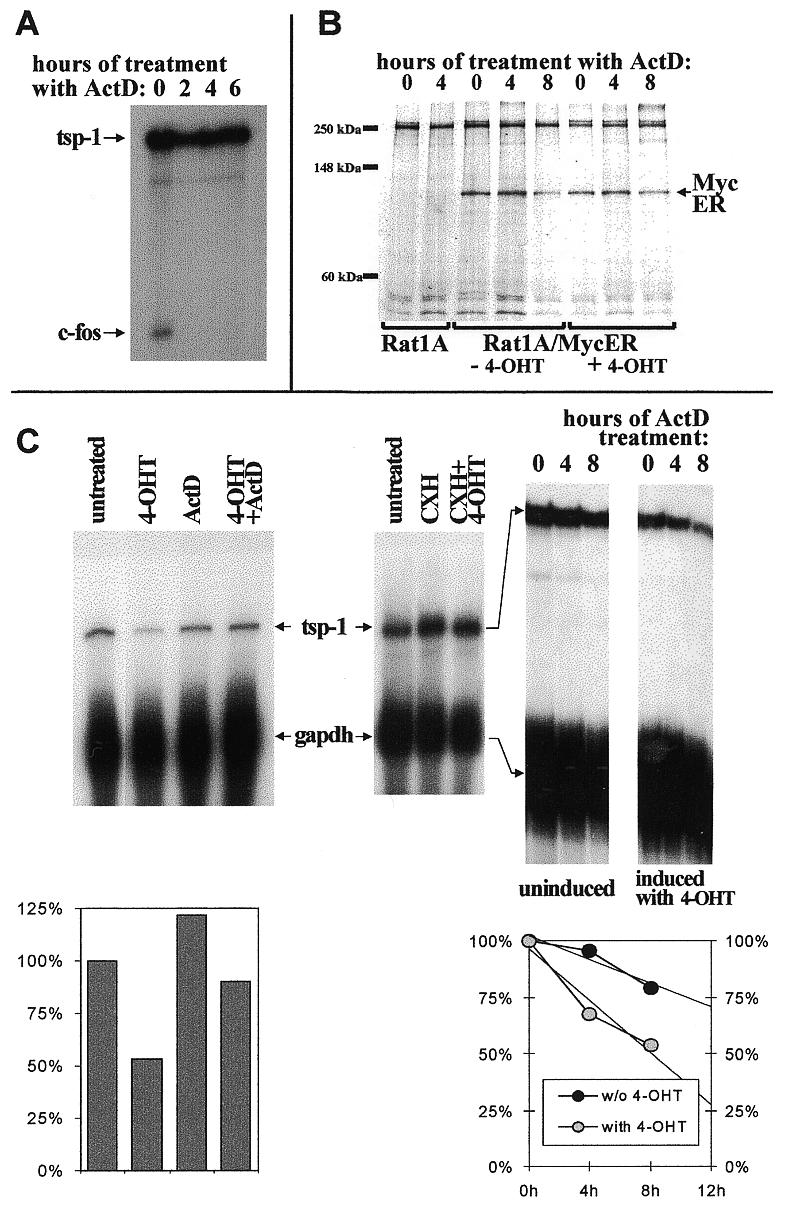
Increased turnover of tsp-1 mRNA in Myc overexpressing cells. (A) RNase protection analysis detecting tsp-1 and c-fos mRNAs in Rat1A/MycER cells treated with ActD for the indicated number of hours. (B) Radioimmunoprecipitation of the MycER fusion protein from lysates of parental Rat-1A and Rat1A/MycER cells, untreated or treated with 4-OHT. Cells were also treated with ActD for the indicated number of hours. MycER protein has the apparent molecular mass of ~95 kDa. Electrophoretic mobility of the molecular mass markers is shown on the left. (C) RNase protection analyses detecting tsp-1 and gapdh (loading control) mRNAs in Rat1A/MycER cells treated with ActD, CHX, 4-OHT or combinations of these drugs. Left, Rat1A/MycER cells were treated with the indicated drug for 12 h. Middle, cells were treated with the indicated drug for 6 h. Right, cells were left untreated (first three lanes) or pre-treated with 4-OHT for 12 h (last three lanes) and then treated with ActD for the indicated number of hours. In the two graphs, tsp:gapdh ratios corresponding to different treatments are plotted as percentages of those observed in untreated cells. In the right graph, the left and right y-axes correspond to untreated and 4-OHT-treated cells, respectively.