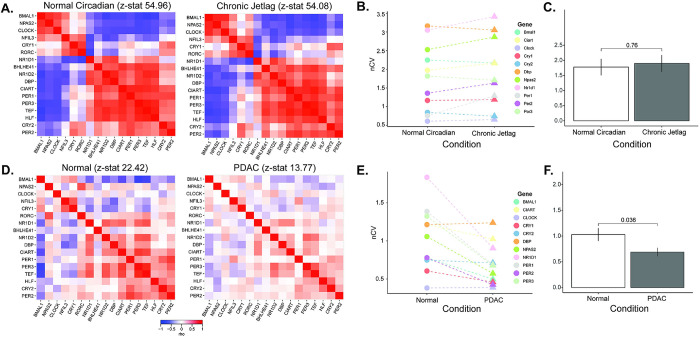
Fig 2. The human pancreatic clock robustness is diminished after malignant transformation.
A. Clock correlation matrices were created for normal circadian (left, n = 72) and chronic jetlag (right, n = 72) mouse pancreas samples. B, C. The normalized coefficient of variation (nCV) was calculated to determine the robustness of the pancreatic clock for the normal circadian (circles) and chronic jetlag (triangles) pancreas samples, with the mean nCV in each group also depicted. Each color indicates a different gene evaluated. D. Clock correlation matrices were created for normal (left; n = 50) and pancreatic ductal adenocarcinoma (right; n = 318) samples. E, F. The normalized coefficient of variation (nCV) was calculated to determine the robustness of the pancreatic clock for the normal (circles) and PDAC (triangles) samples, with the mean nCV in each group also depicted. Each color indicates a different gene evaluated.

