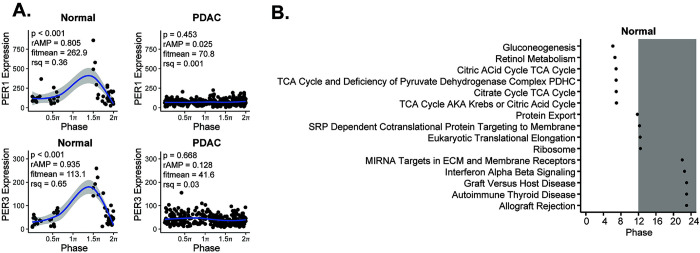
Fig 4. The human pancreatic cancer tumor clock is dysfunctional relative to the normal pancreas.
A. CYCLOPS was used to reorder samples from normal (n = 50) and pancreatic ductal adenocarcinoma (n = 318) TCGA and CPTAC-3 samples. Each point represents an individual patient with order determined by paired eigengenes. Plots from several core clock genes reordered by CYCLOPS in normal tissue as compared to best reordering in PDAC (A) are shown–ordered from 0 to 2π. Shading around the blue regression line indicates the 95% confidence interval. Relative amplitude (rAMP) for each gene is determined by dividing the amplitude by the fitted expression baseline (fitmean). The fitmean value can be conceptualized as a mean level of expression of that gene across the dataset, and therefore a minimum level of expression (fitmean > 16) is required for rhythmicity cutoff. The goodness of fit of the experimental values by cosinor regression was calculated by R2(rsq). Using these collective parameters, a p < 0.05, rAMP > 0.1, goodness of fit (rsq) > 0.1, and fitmean > 16 were considered rhythmic [27]. B. Graphical representation of Phase Set Enrichment Analysis (PSEA) of normal pancreatic samples, ordered by phase of expression.

