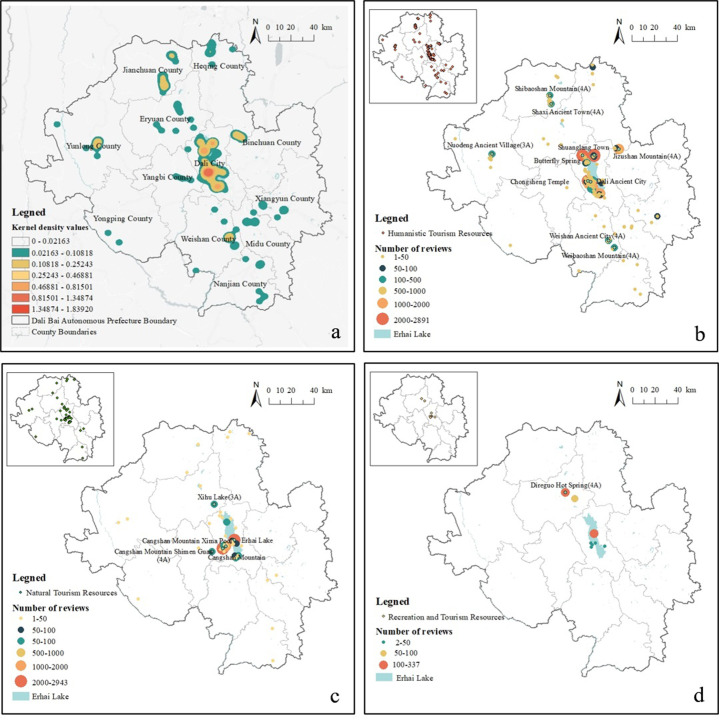
Fig 3. Spatial distribution of tourists’ perceived tourism resources.
Notes: a. Kernel density map of tourists’ perceived tourism resources; b. Perceived degree of humanistic resources; c. Perceived degree of natural resources; d. Perceived degree of recreation and tourism resources. The circle in the graph represents the number of reviews, i.e. the larger the circle, the more reviews. The graph in the upper-left corner indicates the geospatial distribution of different types of tourism resources. The base map images are from the China Ministry of Natural Resources(http://bzdt.ch.mnr.gov.cn/index.html). The drawing approval number is GS (2016)1593.

